Introduction
- SciPy vs NumPy
- Overview of SciPy features and components
Getting Started
- Installing SciPy
- Understanding basic functions
Implementing Scientific Computing
- Using SciPy constants
- Calculating integrals
- Solving linear equations
- Creating matrices with sparse and graphs
- Optimizing or minimizing functions
- Performing significance tests
- Working with different file formats (Matlab, IDL, Matrix Market, etc.)
Visualizing and Manipulating Data
- Implementing K-means clustering
- Using spatial data structures
- Processing multidimensional images
- Calculating Fourier transformations
- Using interpolation for fixed data points
Troubleshooting
Summary and Next Steps
Introduction
Data Science in Depth
- What is Plotly? What is Dash?
- Pandas overview
- Numpy overview
Plotly Basics
Preparing the Development Environment
- Installing and configuring Plotly
- Installing and configuring Dash
Dash Core Components
- Using drowdown and slider components
- Uploading CSV, XLS, and images
- Working with Dash layouts
- Converting Plotly plots to dashboards
- Using callbacks
- Working with inputs and outputs
Dash Dashboards
- Pulling API data
- Building a binance dashboard
- Connecting Dash components
- Using alpha vantage
- Cleaning data
- Controlling callbacks
- Updating graphs
- Working with layout updating
Deployment
- Working with app authorization
- Deploying with Heroku
Summary and Conclusion
Introduction
Google Analytics Overview
- What is Google Analytics?
- Google Analytics features
Preparing the Environment
- Setting up Google Analytics
Administration
Reporting
- Importing and exporting data
- Creating custom reports
- Creating and sharing dashboards
- Adding shortcuts
Data Visualizations
- Adding and comparing metrics
- Sorting data
- Creating charts and graphs
- Using the search features
Summary and Conclusion
Introduction
Drone Mapping
Post-Processing
- What is post processing?
- GIS, CAD, and more
Preparing the Development Environment
- Installing and configuring QGIS
- Installing and configuring AutoCAD
QGIS and AutoCAD
- Post-processing data and images
- Clipping data and images
- Using plug-ins
Google Earth Pro
- Visualizing drone data
- Post-processing data and images
GIMP
- Post-processing data and images
Reports
Summary and Conclusion
Overview
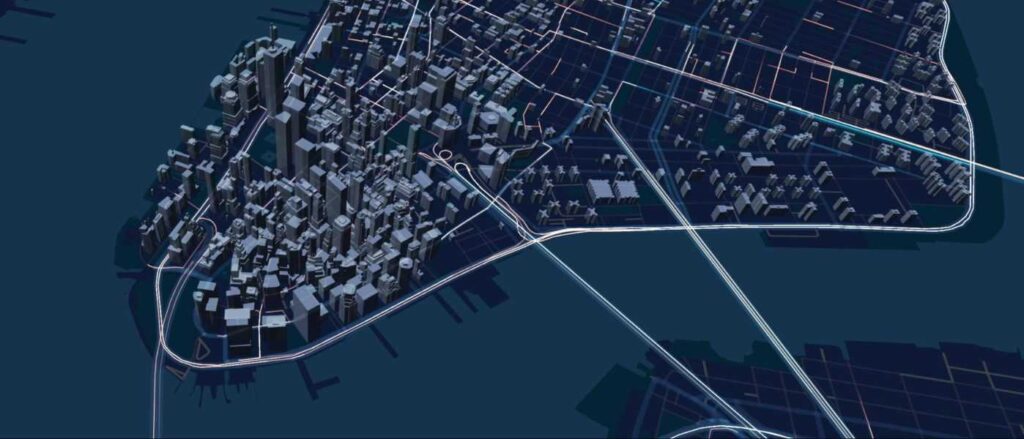
deck.gl is an open-source, WebGL-powered library for exploring and visualizing data assets at scale. Created by Uber, it is especially useful for gaining insights from geospatial data sources, such as data on maps.
This instructor-led, live training introduces the concepts and functionality behind deck.gl and walks participants through the set up of a demonstration project.
By the end of this training, participants will be able to:
- Take data from very large collections and turn it into compelling visual representations
- Visualize data collected from transportation and journey-related use cases, such as pick-up and drop-off experiences, network traffic, etc.
- Apply layering techniques to geospatial data to depict changes in data over time
- Integrate deck.gl with React (for Reactive programming) and Mapbox GL (for visualizations on Mapbox based maps).
- Understand and explore other use cases for deck.gl, including visualizing points collected from a 3D indoor scan, visualizing machine learning models in order to optimize their algorithms, etc.
Audience
- Developers
- Data scientists
Format of the course
- Part lecture, part discussion, exercises and heavy hands-on practice
Course Outline
To request a customized course outline for this training, please contact us to arrange.