Introduction
Geospatial and Spatial Data
- Vector vs Raster data
- Metadata
- Projection and coordinate systems
Python in Depth
- Data types
- Variables, functions and conditional statements
- Loops and lists
- Classes and objects
ArcPy for ArcGIS
- Help overview
- Tool and Python references
Preparing the Development Environment
- Installing and configuring ArcGIS Desktop
Geoprocessing and Workflows
- Creating a project
- Saving code as a script
- Working with toolboxes
- Creating a custom toolbox
- Documenting scripts
- Overwriting output
- Setting current workspace and extent in geoprocessing
ArcPy Package
- Performing inventory
- Listing workspaces, datasets, classes, tables, and fields
- Describing and walking data
- Working with geometries
- Using arcpy.da
- Implementing symbology
- Adding and manipulating layers
Summary and Conclusion
Introduction
ArcGIS System Software
- What is GIS?
- ArcGIS versions
- Layers, attributes, features, selections, and attribute tables
Geospatial and Spatial Data
- Vector vs Raster data
- Metadata
- Projection and coordinate systems
Preparing the Development Environment
- Installing and configuring ArcGIS Desktop
ArcGIS and its Functionalities
- Applying and visualizing spatial data
- Identifying features and values
- Creating selections
- Zooming and measuring
- Using ShapeFile geometry
- Working coordinate systems
- Using ArcCatalog
- Modifying metadata
Raster Data
- Displaying rasters
- Merging rasters
- Resampling and reclassifying rasters
- Clipping a raster
- Extracting raster value points
- Geo-refrencing a raster
Vector Data
- Using ShapeFile attributes
- Spatial joining with tabular data
- Creating choropleth maps
Organize Maps
- Adding data to a map
- Importing data
- Editing properties and symbology
Data Creation
- Implementing new data files
- Drawing new features
- Plotting points
- Joining data
- Clipping data
- Creating buffers
Finalizations and Optimizations
- Using map layouts
- Working with a locator map
- Creating legends
- Implementing scale bars and titles
- Exporting and printing maps
Summary and Conclusion
Overview
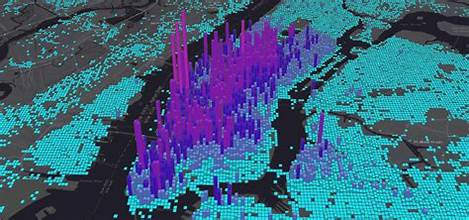
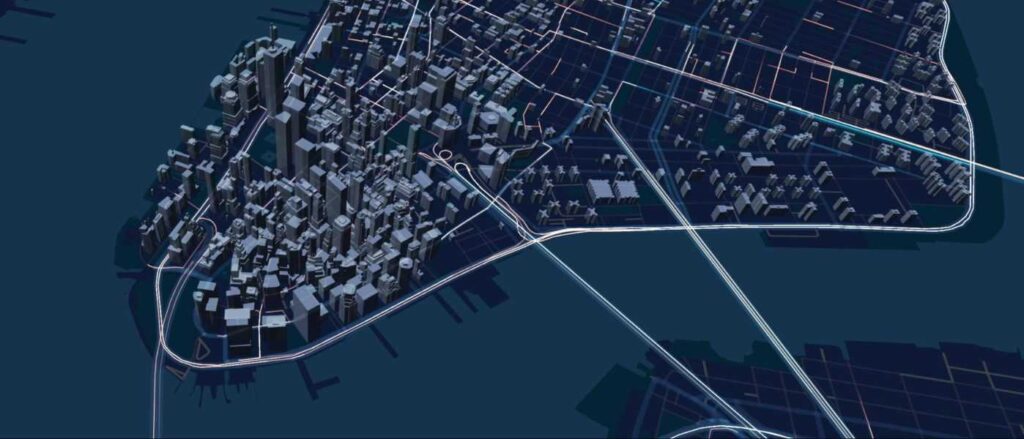
deck.gl is an open-source, WebGL-powered library for exploring and visualizing data assets at scale. Created by Uber, it is especially useful for gaining insights from geospatial data sources, such as data on maps.
This instructor-led, live training introduces the concepts and functionality behind deck.gl and walks participants through the set up of a demonstration project.
By the end of this training, participants will be able to:
- Take data from very large collections and turn it into compelling visual representations
- Visualize data collected from transportation and journey-related use cases, such as pick-up and drop-off experiences, network traffic, etc.
- Apply layering techniques to geospatial data to depict changes in data over time
- Integrate deck.gl with React (for Reactive programming) and Mapbox GL (for visualizations on Mapbox based maps).
- Understand and explore other use cases for deck.gl, including visualizing points collected from a 3D indoor scan, visualizing machine learning models in order to optimize their algorithms, etc.
Audience
- Developers
- Data scientists
Format of the course
- Part lecture, part discussion, exercises and heavy hands-on practice
Course Outline
To request a customized course outline for this training, please contact us to arrange.