You Will Learn how to implement some of the most common machine learning algorithms in PHP
You will Learn about the some of the common algorithms like classification, regression, clustering
You will learn about Supervised and Unsupervised learning
You will NOT learn the details and mathmatics of each algorithm. Our focus is mainly on implementing them in PHP
You will Learn about the steps to build a machine learning model
You will Learn how to divide your data to training set and test set
You will Learn how to train your machine learning model
You will Learn how to make prdictions
You will learn about the persistency of your model
Requirements
Basic knowledge of Machine learning is a plus because we are not going though the details of each algorithm and our main focus is on the implementation in PHP
Description
WHY Machine Learning
Machine learning is a rapidly growing field that is changing the way technology and solving complex problems.
Machine learning is widely used in industries such as healthcare, finance, marketing, and self-driving cars to automate processes, improve decision making, and provide personalized experiences to customers.
The amount of data generated by society is continually growing, further increasing the demand for skilled machine learning practitioners.
Learning machine learning provides valuable skills for a career in technology and data science.
The demand for machine learning talent is growing at a rapid pace, with the number of job postings for machine learning roles increasing by over 75% in the past 5 years.
WHY PHP
PHP is used in more than 70 percent of the websites across the Internet. That’s HUGE!
PHP is more alive than ever! It’s simple yet very powerful. It’s secure. It’s scalable.It’s very easy to learn.
Just to get an idea of how powerful PHP is, Websites like Facebook, Wikipedia, Slack, MailChimp, Flickr, SourceForge, Tumblr, Etsy and Yahoo have PHP as their core.
oh and not to forget, the biggest blogging system on the web (WordPress), is powered by PHP.
enough teasing let’s get started with Machine Learning in PHP.
In this course:
You Will Learn how to implement some of the most common machine learning algorithms in PHP
You will Learn about the some of the common algorithms like classification, regression, clustering
You will learn about Supervised and Unsupervised learning
You will NOT learn the details and mathmatics of each algorithm. Our focus is mainly on implementing them in PHP
You will Learn about the steps to build a machine learning model
You will Learn how to divide your data to training set and test set
You will Learn how to train your machine learning model
You will Learn how to make prdictions
You will learn about the persistency of your model
and a lot more
Prior Knowledge
Basic knowledge of Machine learning is a plus because we are not going though the details of each algorithm and our main focus is on the implementation in PHP
Basic Knowledge about PHP is a plus.
This Course is for:
PHP Developers who want to start their journey in Machine Learning
Developers who are familiar with Machine Learning and want to learn how to implement them in PHP
Curious to learn about Machine Learning
If this is you, then what are you waiting for?!Let’s get Started
Who this course is for:
PHP Developers who want to start their journey in Machine Learning
Developers who are familiar with Machine Learning and want to learn how to implement them in PHP
5 Simple Steps to Choose the Best Machine Learning Algorithm That Fits Your AI Project Needs
Step 1. Understand Your Project Goal
Step 2. Analyze Your Data by Size, Processing, and Annotation Required
Step 3. Evaluate the Speed and Training Time
Step 4. Find Out the Linearity of Your Data
Step 5. Decide on the Number of Features and Parameters
TL;DR
The variety of tasks that machine learning can help you with may be overwhelming. Despite this, the majority of tasks can be solved using a limited number of ML algorithms. Still, you need to know, which of them to choose, when to use them, what parameters to take into consideration, and how to test the ML algorithms. We’ve composed this guide to help you with this specific problem in a pragmatic and easy way.
What Is a Machine Learning Algorithm?
Let’s start with the basics in case you’re still a bit in the dark about what this all is and why you might need it. We’ll talk about what machine learning is and what types of algorithms there are. If you feel like you already know this, you can skip to the step-by-step guide on choosing ML algorithms.
Machine learning is an algorithm-based method for analyzing data with the goal of looking for patterns and making accurate predictions. As the name suggests, ML algorithms are basically computers trained in different ways. These ways are the types of ML algorithms that fall into three and a half broad categories (we’ll explain the “and a half” part a bit later, be patient).
Humanity creates more and more data every day. It comes from a variety of sources: business data, personal social media activity, sensors of IoT, etc. Machine learning algorithms are used to take this data and turn it into something useful that can serve to automate processes, personalize experiences, and make complex predictions that human brains cannot do on their own.
Given the variety of tasks that ML algorithms solve, each type specializes in certain tasks, taking into consideration the features of the data that you have and the requirements of your project. Let’s take a look at each of the major types of ML algorithms and certain examples used for the most common tasks.
Types of ML Algorithms: Choose Your Fighter
There are three major types of ML algorithms: unsupervised, supervised, and reinforcement. An additional one (that we previously counted as “and a half”) is semi-supervised and comes from the combination of supervised and unsupervised. We’ll talk about the unique features and examples of each of these types.
Unsupervised ML Algorithms
Unsupervised machine learning algorithms
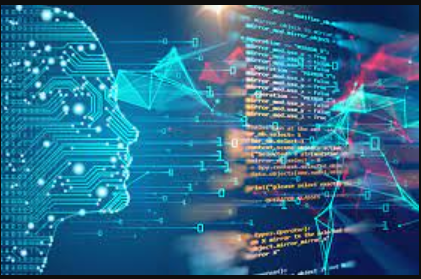
This type of machine learning algorithm arguably represents artificial intelligence in its true form. Unsupervised ML is based on the idea that a machine can learn without any guidance from humans. For learning, it uses unlabeled data, which is basically raw data that can be found “in the wild” and is usually unstructured and unprocessed.
Naturally, unsupervised machine learning algorithms have a lot of limitations. As they don’t have any starting point for their training, there are only a few types of tasks that they can perform. The two major ones that we’ll highlight are clustering and dimensionality reduction.
Clustering
While a clustering algorithm won’t be able to tell if you show it the photo of a cat, it can definitely learn to tell a cat from a tree. This means that your computer can tell two different things apart based on their naturally different features and put them into separate groups (clusters). At the same time, it won’t be able to tell you what type of object is in each cluster.
Clustering is great for solving tasks such as spam filtering, fraud detection, primary personalization for marketing, hierarchical clustering for document analysis, etc.
Dimensionality Reduction
Look for dimensionality reduction algorithms in projects that deal with the data that has lots of features and/or variables. The major idea behind this type of algorithm is processing and simplification of the data by decreasing the number of features. The dimensionality reduction model reduces the features that are not essential for the task at hand but leaves the structure and main features of the data intact.
Noise reduction and data visualization are common tasks for dimensionality reduction algorithms. It is also commonly used as an intermediate step in more complex ML projects.
Supervised ML Algorithms
Supervised machine learning algorithms
This is arguably the largest and most popular group of machine learning algorithms. And no wonder: supervised learning is flexible, comprehensive, and covers a lot of the common ML tasks that are in high demand today.
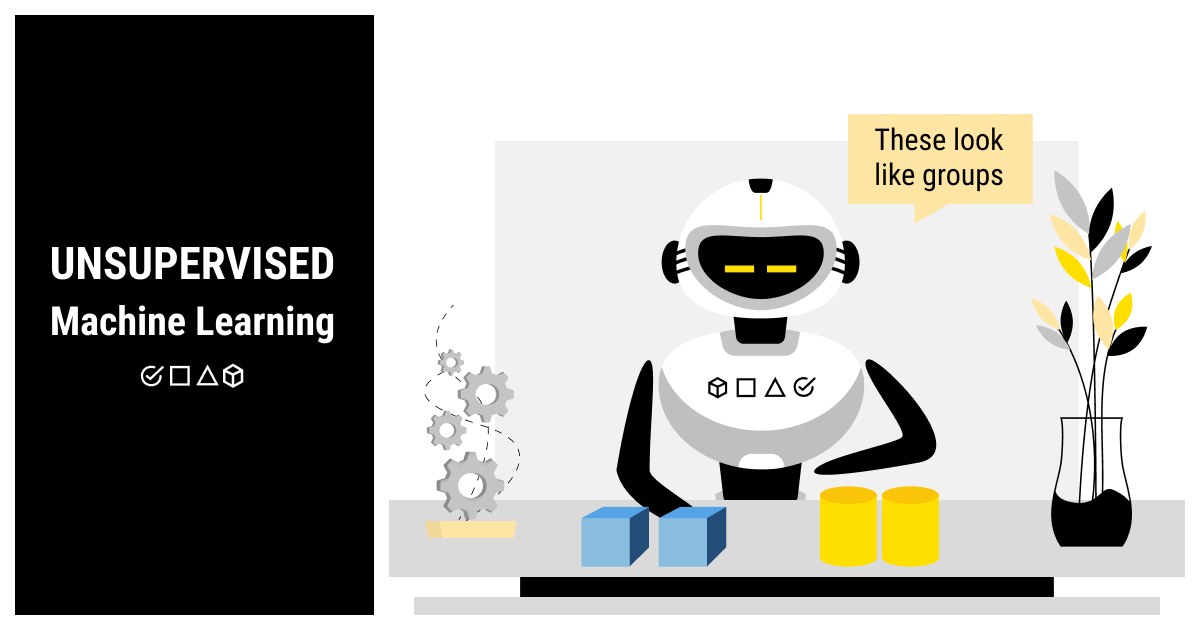
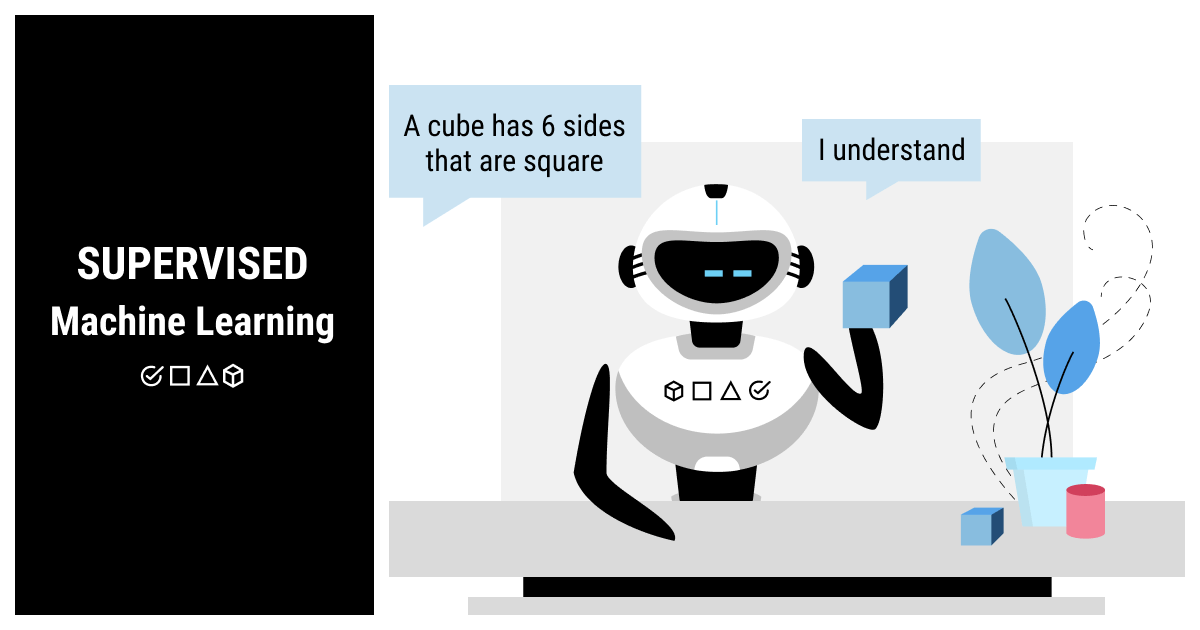
In opposition to unsupervised learning, supervised algorithms require labeled data. This means that the models train based on the data that has been processed (cleaned, randomized, and structured) and annotated. The processing and annotation of the data is supervision that a human has over the training process (hence the name of supervised learning).
Annotation, also known as labeling, is an essential process for building a supervised ML algorithm. In a nutshell, it requires adding labels or tags to the pieces of data, which will tell the algorithm how to make sense of it. It’s quite a time-consuming and labor-intensive process that usually gets outsourced to save time for the core business tasks.
There are quite a few interesting algorithm types in supervised learning. For the purposes of brevity, we’ll discuss regression, classification, and forecasting.
Regression
It’s a common case that analysis is required for continuous values to find a correlation between different variables. Regression helps to look for this correlation and predict an output.
This type of supervised algorithm is commonly used to predict the prices or value of certain objects based on a set of their features. Thus, a house will be evaluated based on its location, the number of bedrooms, and if anyone died in it 😉
Classification
Similar to clustering that we’ve already seen in unsupervised machine learning algorithms, classification allows training the AI to group different objects (values) into categories (or classes). The difference is that, now, the machine knows, which class contains which objects. If, after training, you show the computer a photo of a cat and ask what it is, it will tell you it’s a cat and not just group it with other cat photos.
Unlike regression, classification is based on a limited number of values. It can be binary (when there are only two classes, e.g., cats or dogs) or multi-class (when there are more than two categories to classify the values).
Forecasting
When you have past and present data, it’s natural that you’d want to predict the future at some point. Forecasting algorithms can help you with this task as they are able to analyze the data in-depth, looking for hidden patterns, and make predictions based on this analysis.
The trends analysis is obviously the forte of this type of machine learning algorithm. That’s why forecasting is commonly used in business and finance.
Semi-Supervised ML Algorithms
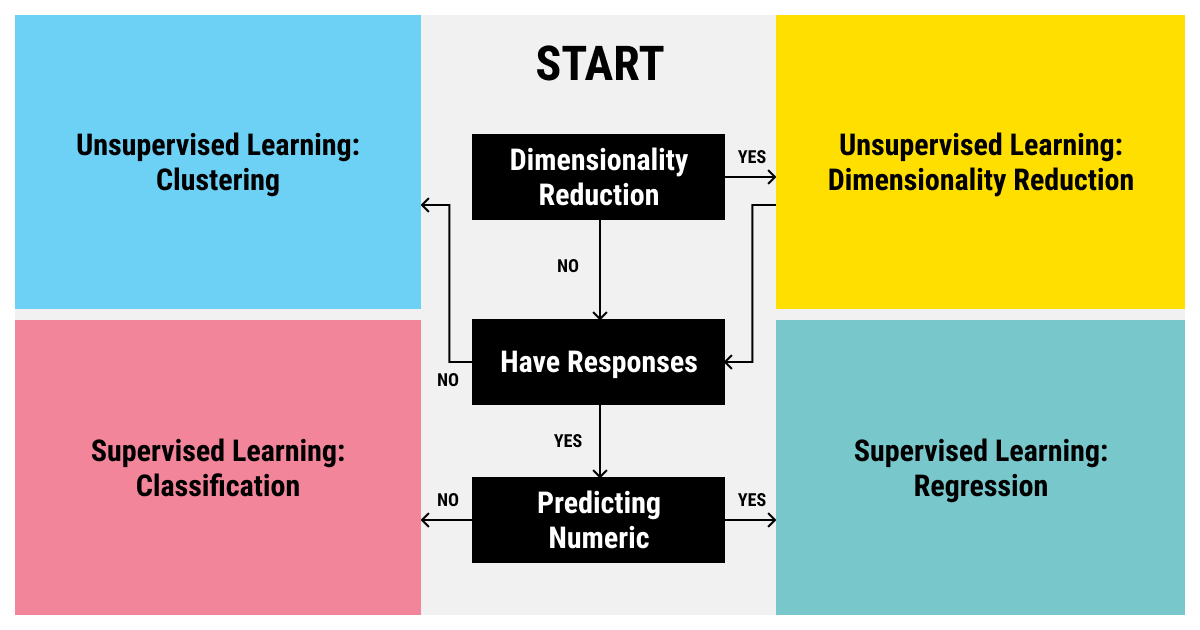
Supervised and unsupervised machine learning algorithms are very common for the majority of AI tasks today. Here’s a simple cheat sheet to facilitate your choice of a machine learning algorithm:
How to choose between supervised and unsupervised ML algorithms
However, sometimes you cannot choose between either an unsupervised or a supervised ML algorithm. There are cases where combining the two algorithms can bring you more benefits even with regard to the growing complexity of your ML model. That’s because of the core features of each type of algorithm: unsupervised learning brings in simplicity and efficiency while supervised learning is all about flexibility and comprehensive goals.
When you combine two different types of algorithms, you get semi-supervised learning. This type of ML algorithm allows you to significantly cut down the financial, human, and time cost for annotating the data. At the same time, semi-supervised learning algorithms are not as restricted in the choice of tasks as supervised learning algorithms.
Reinforcement ML Algorithms
Reinforcement machine learning algorithms
And now for something completely different. Unsupervised and supervised algorithms both work with the data, either unlabeled or labeled. A reinforcement algorithm trains within an environment with a set of rules and a defined goal.
Reinforcement learning algorithms are usually based on dynamic programming techniques. The idea behind this type of ML algorithm is balancing exploration and exploitation. There is some uncharted territory that an algorithm can explore but every action will be followed by a response from a system, either positive or negative. Training on these responses, the algorithm will learn to choose the best set of actions to achieve the set goal.
A classic reinforcement learning application is games such as chess or Go. Learning to play (and win) these games requires the algorithm to understand the environment (the board, the set of rules, and the actions that can be either punished (by the other player taking the pieces) or rewarded (by winning the opponent’s pieces). A more modern and fascinating example of a reinforcement algorithm is training autonomous vehicles. The algorithm is required to navigate the environment without hitting anything and obeying the traffic rules.
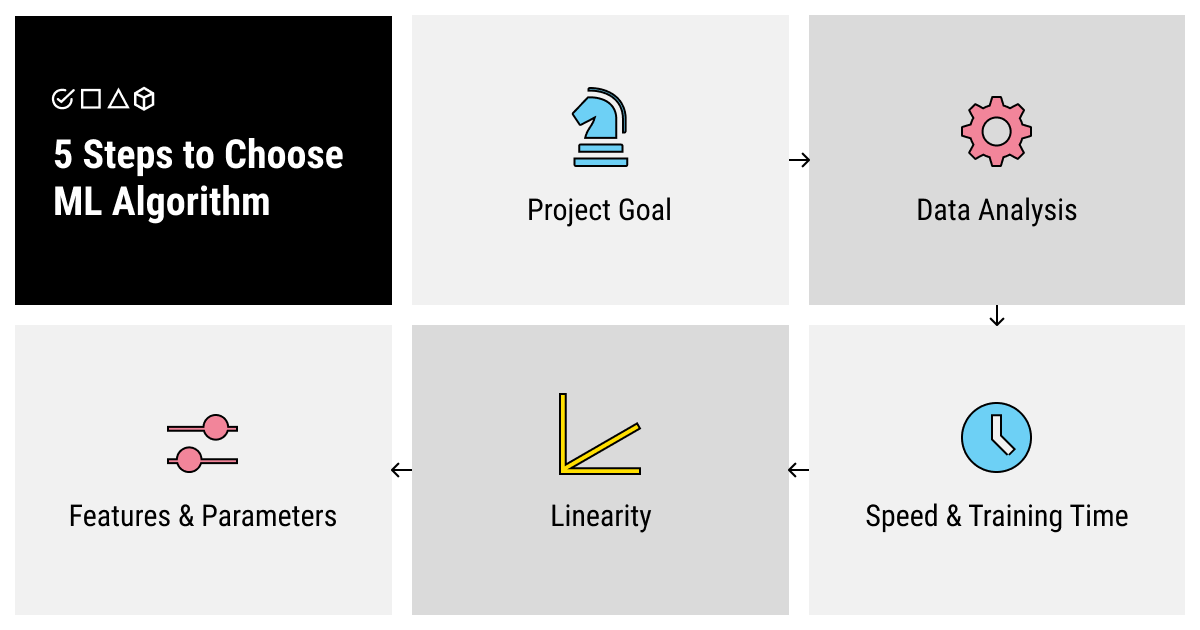
5 Simple Steps to Choose the Best Machine Learning Algorithm That Fits Your AI Project Needs
5 steps to choose and ML algorithm
Learning about the different types of machine learning algorithms is not enough to understand how to choose the one that fits your specific purpose. So let’s stick to an incremental method and see how exactly you can approach this problem.
Step 1. Understand Your Project Goal
As it has already become apparent, each machine learning algorithm was designed to solve a specific problem. So, first of all, you should consider the type of project that you’re dealing with.
Answer this question: what kind of an output do you need? Do you need an algorithm for prediction based on the previous data? Turn to supervised forecasting algorithms. Are you looking for an image recognition model that will work with poor-quality photos? Dimensionality reduction in combination with classification will help you with it. Do you need to teach your model to play a new game? A reinforcement algorithm will be your best bet.
Step 2. Analyze Your Data by Size, Processing, and Annotation Required
When you’ve answered the question of what type of output you need, ask yourself what input do you have. What is your data like? Is it raw, just collected from wherever, and requires processing? Is it biased, dirty, and unstructured? Or do you already have a big annotated dataset on your hands? Do you have enough data or is additional collecting (or even collecting from scratch) required? Do you need to spend time preparing your data for the training process or are you good to go?
Insufficient, poor-quality, unprocessed data usually doesn’t lend itself to great training of a supervised algorithm. You should decide if you want to spend time and resources on preparing the best data you can before starting the training process. If not, you can opt for unsupervised algorithms but keep in mind the limitations of such a choice.
Step 3. Evaluate the Speed and Training Time
Here’s another question for you to answer that can help you understand what type of machine learning algorithm you need. Do you need it fast even if it means lower quality of training (and, respectively, predictions)? More and higher-quality data lead to better training. Can you allocate the required time for proper training?
Step 4. Find Out the Linearity of Your Data
Another important question is what the environment of your problem is like? Linear algorithms (such as linear regression or support vector machines) are simpler and faster to train. However, they are not usually used for more complex problems as they deal with linear data. If the data is multifaceted, multidimensional, and has many intersecting correlations, linear algorithms might not be sufficient for your task.
Step 5. Decide on the Number of Features and Parameters
Finally, how complex and accurate your final AI model should be? Don’t forget that longer training usually leads to better, more accurate performance when the AI model is deployed. You can specify more features and parameters for your model to interpret if you have time to let it train longer. So giving your algorithm more time to learn may be a good investment into your future output accuracy and interpretability.
TL;DR
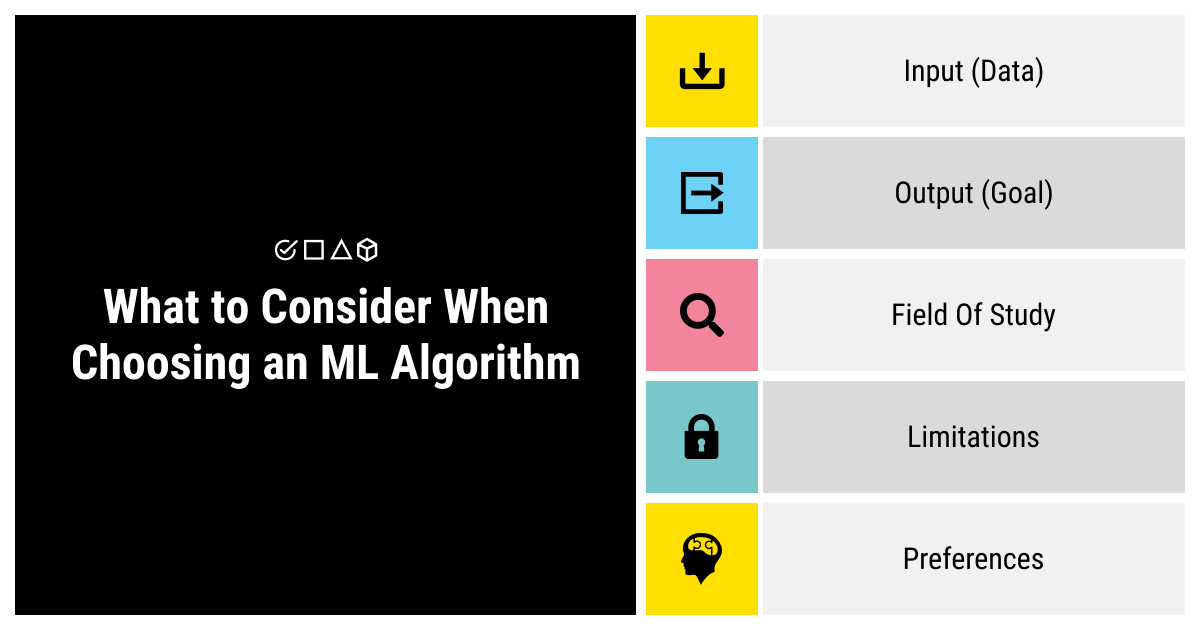
What to consider when choosing an ML algorithm
Choosing a machine learning algorithm is obviously a complex task, especially if you don’t have extensive experience in this field. However, learning about the types of algorithms and the tasks that they were designed to solve and answering a set of questions might help you solve this problem. Try to outline as much as you can about:
Your input (the data: is it collected/sufficient/processed/annotated?)
Your output (what goal do you pursue?)
Your field of study (how linear or complex the data is?)
Your limitations (can you spare time and resources?)
Your preferences (what features do you absolutely need for success?)
Learning more about machine learning algorithms, their types (from supervised and unsupervised to semi-supervised and reinforcement learning), and answering these questions might lead you to an algorithm that’ll be a perfect match for your goal.
Over the course of an hour, an unsolicited email skips your inbox and goes straight to spam, a car next to you auto-stops when a pedestrian runs in front of it, and an ad for the product you were thinking about yesterday pops up on your social media feed. What do these events all have in common? It’s artificial intelligence that has guided all these decisions. And the force behind them all is machine-learning algorithms that use data to predict outcomes.
Now, before we look at how machine learning aids data analysis, let’s explore the fundamentals of each.
What is Machine Learning?
Machine learning is the science of designing algorithms that learn on their own from data and adapt without human correction. As we feed data to these algorithms, they build their own logic and, as a result, create solutions relevant to aspects of our world as diverse as fraud detection, web searches, tumor classification, and price prediction.
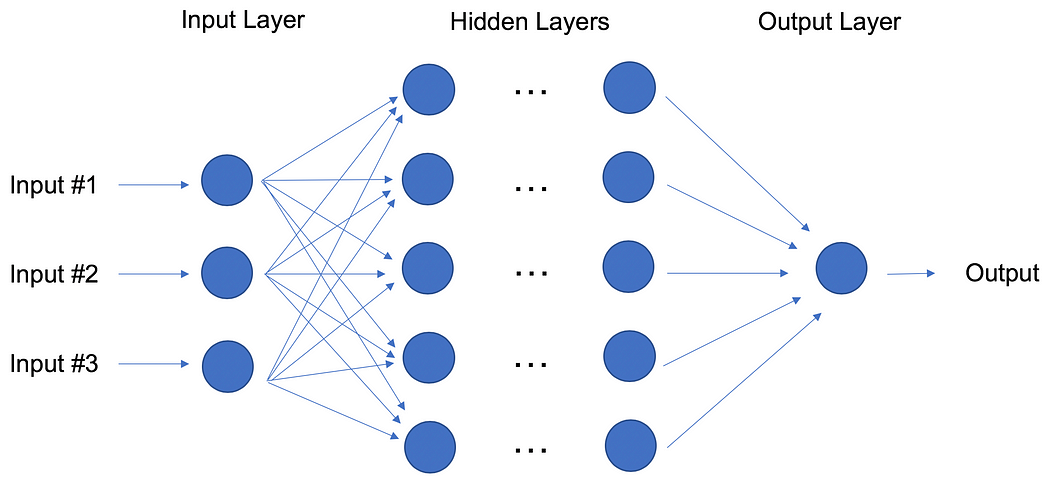
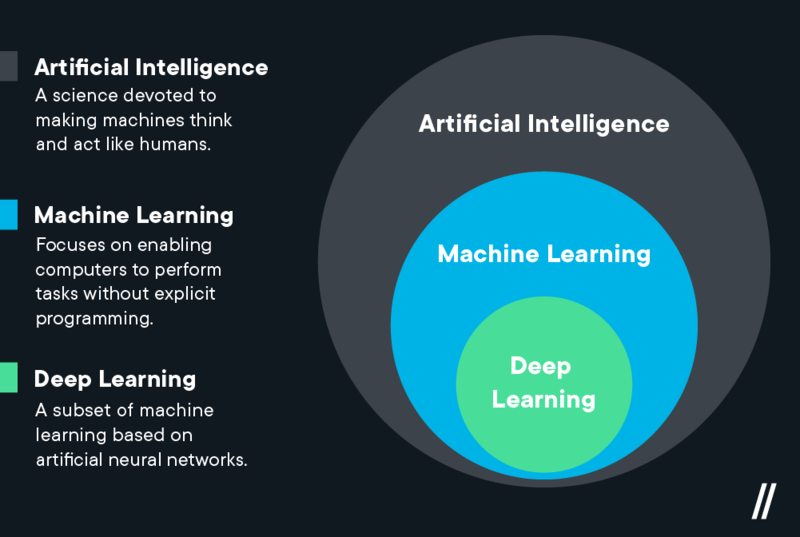
In deep learning, a subset of machine learning, programs discover intricate concepts by building them out of simpler ones. These algorithms work by exposing multilayered (hence “deep”) neural networks to vast amounts of data. Applications for machine learning, such as natural language processing, dramatically improve performance through the use of deep learning.
What is Data Analysis?
Data analysis involves manipulating, transforming, and visualizing data in order to infer meaningful insights from the results. Individuals, businesses,and even governments often take direction based on these insights.
Data analysts might predict customer behavior, stock prices, or insurance claims by using basic linear regression. They might create homogeneous clusters using classification and regression trees (CART), or they might gain some impact insight by using graphs to visualize a financial technology company’s portfolio.
Until the final decades of the 20th century, human analysts were irreplaceable when it came to finding patterns in data. Today, they’re still essential when it comes to feeding the right kind of data to learning algorithms and inferring meaning from algorithmic output, but machines can and do perform much of the analytical work itself.
Why Machine Learning is Useful in Data Analysis
Machine learning constitutes model-building automation for data analysis. When we assign machines tasks like classification, clustering, and anomaly detection — tasks at the core of data analysis — we are employing machine learning.
We can design self-improving learning algorithms that take data as input and offer statistical inferences. Without relying on hard-coded programming, the algorithms make decisions whenever they detect a change in pattern.
Before we look at specific data analysis problems, let’s discuss some terminology used to categorize different types of machine-learning algorithms. First, we can think of most algorithms as either classification-based, where machines sort data into classes, or regression-based, where machines predict values.
Next, let’s distinguish between supervised and unsupervised algorithms. A supervised algorithm provides target values after sufficient training with data. In contrast, the information used to instruct an unsupervised machine-learning algorithm needs no output variable to guide the learning process.
For example, a supervised algorithm might estimate the value of a home after reviewing the price (the output variable) of similar homes, while an unsupervised algorithm might look for hidden patterns in on-the-market housing.
As popular as these machine-learning models are, we still need humans to derive the final implications of data analysis. Making sense of the results or deciding, say, how to clean the data remains up to us humans.
Machine-Learning Algorithms for Data Analysis
Now let’s look at six well-known machine-learning algorithms used in data analysis. In addition to reviewing their structure, we’ll go over some of their real-world applications.
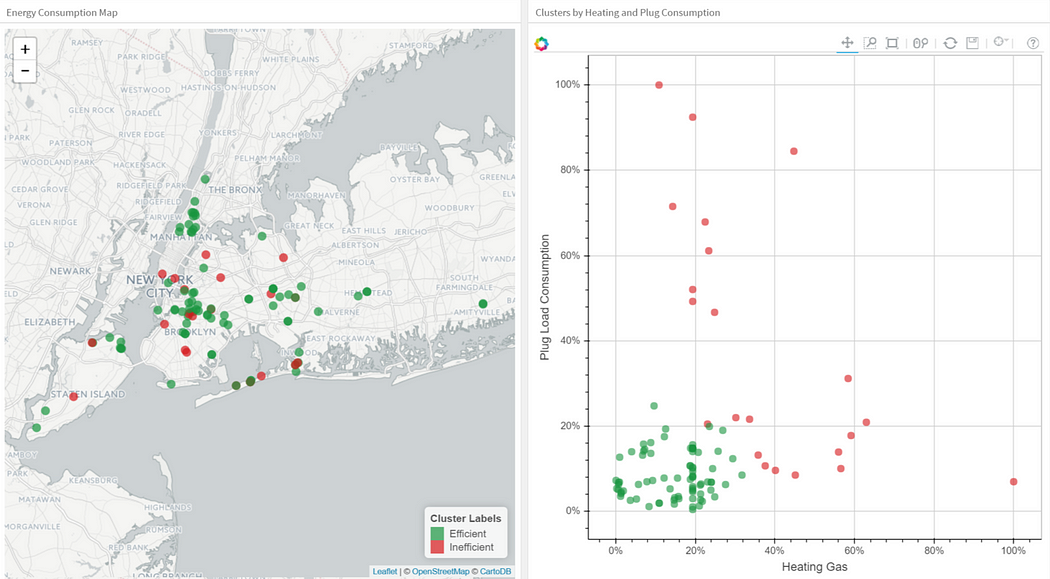
Clustering
At a local garage sale, you buy 70 monochromatic shirts, each of a different color. To avoid decision fatigue, you design an algorithm to help you color-code your closet. This algorithm uses photos of each shirt as input and, comparing the color of each shirt to the others, creates categories to account for every shirt. We call this clustering: an unsupervised learning algorithm that looks for patterns among input values and groups them accordingly. Here is a GeeksForGeeks article that provides visualizations of this machine-learning model.
Decision-tree learning
You can think of a decision tree as an upside-down tree: you start at the “top” and move through a narrowing range of options. These learning algorithms take a single data set and progressively divide it into smaller groups by creating rules to differentiate the features it observes. Eventually, they create sets small enough to be described by a specific label. For example, they might take a general car data set (the root) and classify it down to a make and then to a model (the leaves).
As you might have gathered, decision trees are supervised learning algorithms ideal for resolving classification problems in data analysis, such as guessing a person’s blood type. Check out this in-depth Medium article that explains how decision trees work.
Ensemble learning
Imagine you’re en route to a camping trip with your buddies, but no one in the group remembered to check the weather. Noting that you always seem dressed appropriately for the weather, one of your buddies asks you to stand in as a meteorologist. Judging from the time of year and the current conditions, you guess that it’s going to be 72°F (22°C) tomorrow.
Now imagine that everyone in the group came with their own predictions for tomorrow’s weather: one person listened to the weatherman; another saw Doppler radar reports online; a third asked her parents; and you made your prediction based on current conditions.
Do you think you, the group’s appointed meteorologist, will have the most accurate prediction, or will the average of all four guesses be closer to the actual weather tomorrow? Ensemble learning dictates that, taken together, your predictions are likely to be distributed around the right answer. The average will likely be closer to the mark than your guess alone.
In technical terms, this machine-learning model frequently used in data analysis is known as the random forest approach: by training decision trees on random subsets of data points, and by adding some randomness into the training procedure itself, you build a forest of diverse trees that offer a more robust average than any individual tree. For a deeper dive, read this tutorial on implementing the random forest approach in Python.
Support-vector machine
Have you ever struggled to differentiate between two species — perhaps between alligators and crocodiles? After a long while, you manage to learn how: alligators have a U-shaped snout, while crocodiles’ mouths are slender and V-shaped; and crocodiles have a much toothier grin than alligators do. But on a trip to the Everglades, you come across a reptile that, perplexingly, has features of both — so how can you tell the difference? Support-vector machine (SVM) algorithms are here to help you out.
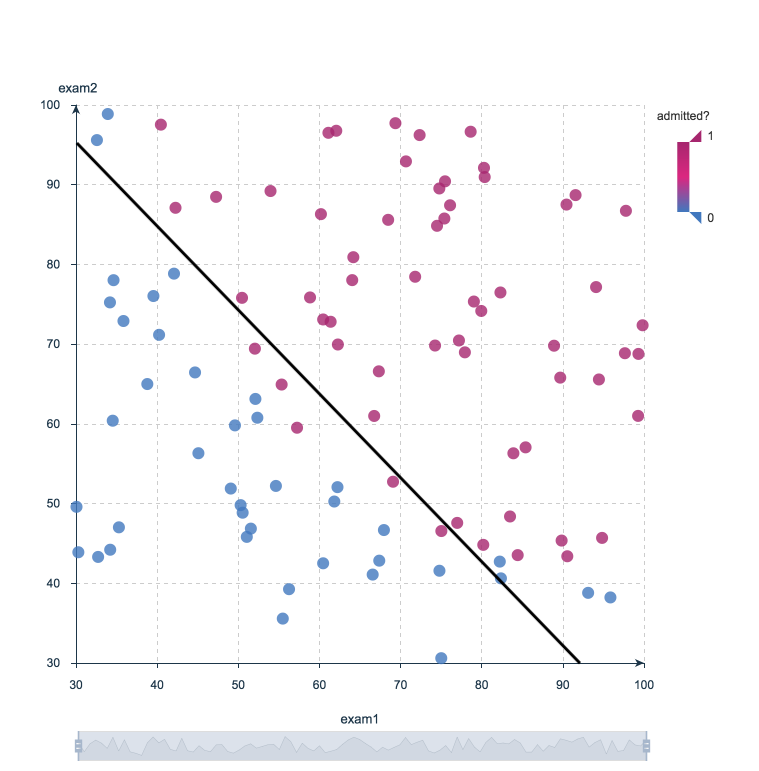
First, let’s draw a graph with one distinguishing feature (snout shape) as the x-axis and another (grin toothiness) as the y-axis. We’ll populate the graph with plenty of data points for both species, and then find possible planes (or, in this 2D case, lines) that separate the two classes.
Our objective is to find a single “hyperplane” that divides the data by maximizing the distance between the dividing plane and each class’s closest points — called support vectors. No more confusion between crocs and gators: once the SVM finds this hyperplane, you can easily classify the reptiles in your vacation photos by seeing which side each one lands on.
SVM algorithms can only be used on categorical data, but it’s not always possible to differentiate between classes with 2D graphs. To resolve this, you can use a kernel: an established pattern to map data to higher dimensions. By using a combination of kernels and tweaks to their parameters, you’ll be able to find a non-linear hyperplane and continue on your way distinguishing between reptiles. This YouTube video does a clear job of visualizing how kernels integrate with SVM.
Linear regression
If you’ve ever used a scatterplot to find a cause-and-effect relationship between two sets of data, then you’ve used linear regression. This is a modeling method ideal for forecasting and finding correlations between variables in data analysis.
For example, say you want to see if there’s a connection between fatigue and the number of hours someone works. You gather data from a set of people with a wide array of work schedules and plot your findings. Seeking a relationship between the independent variable (hours worked) and the dependent variable (fatigue), you notice that a straight line with a positive slope best models the correlation. You’ve just used linear regression! If you’re interested in a detailed understanding of linear regression for machine learning, check out this blog pos from Machine Learning Mastery.
Logistic regression
While linear regression algorithms look for correlations between variables that are continuous by nature, logistic regression is ideal for classifying categorical data. Our alligator-versus-crocodile problem is, in fact, a logistic regression problem. Whereas the SVM model can work with non-linear kernels, logistic regression is limited to (and great for) linear classification. See this in-depth overview of logistic regression, especially good for lovers of calculus.
Summary
In this article, we looked at how machine learning can automate and scale data analysis. We summarized a few important machine-learning algorithms and saw their real-life applications.
While machine learning offers precision and scalability in data analysis, it’s important to remember that the real work of evaluating machine learning results still belongs to humans. If you think this could be a career path for you, check out Udacity’s Become a Machine Learning Enginee course.
Machine Learning seems to be the engineering industry’s latest buzzword – a technology with astonishing potential, yet one that many businesses struggle to understand, let alone embrace. Just last year, fewer than one-third (23%) of businesses had adopted any level of Machine Learning automation, and only 5% reported using it extensively. However, there’s been a recent surge in implementation across a variety of industries, from automotive to finance, as companies begin to grasp the sizable benefits Machine Learning can bring.
For businesses looking to adopt Machine Learning, a crucial first step is to ensure that decision-makers have a technological understanding of what exactly Machine Learning is, and the business potential that can be unlocked through this understanding.
At a base level, Machine Learning teaches computers to do what comes naturally to humans and animals: learn from experience. This involves the use of algorithms that can “learn” directly from data without relying on a predetermined equation as a model. The algorithms adaptively improve their performance as the number of available data samples increases. The ever-growing volume of data drives Machine Learning’s potential within business applications.
More Data, More Questions, Better Answers
Machine Learning algorithms find natural patterns in data and derive insights that lead to better predictions and decisions. These algorithms are used in medical diagnosis, stock trading, energy load forecasting, and more. Streaming sites like Netflix rely on Machine Learning to sift through millions of options to render movie recommendations. Additional applications include:
Computational finance, for credit scoring, algorithmic trading, and sentiment analysis
Image processing and computer vision, for face recognition, motion detection, and object detection
Computational biology, for tumor detection, drug discovery, and DNA sequencing
Automotive, aerospace, and manufacturing, for predictive maintenance
How Machine Learning Works
Machine Learning uses two types of techniques: supervised learning, which trains a model on known input and output data so it can predict future outputs, and unsupervised learning, which finds hidden patterns or intrinsic structures in input data.
Supervised Learning
The aim of supervised Machine Learning is to build a model that makes predictions based on evidence in the presence of uncertainty. A supervised learning algorithm takes a known set of input data and known responses to the data (output) and trains a model to generate reasonable predictions for the response to new data.
These predictions are developed through classification and regression techniques.
Classification techniques predict discrete responses—for example, whether an email is legitimate or spam, or whether a tumor is cancerous or benign. Classification models classify input data into categories. Typical applications include medical imaging, speech recognition, and credit scoring.
Regression techniques predict continuous responses—for example, changes in temperature or fluctuations in power demand.
If applied correctly, the intuitive capabilities of supervised learning techniques are almost limitless. They have even been used by clinicians to closely predict whether a person is at risk of a heart attack by accessing data on previous patients, including age, weight, height, and blood pressure, and historical knowledge of those who have had heart attacks previously.
Unsupervised Learning
Unsupervised learning is used to draw inferences from data sets consisting of input data without labeled responses.
Clustering is the most common unsupervised learning technique. It is used for exploratory data analysis to find hidden patterns or groupings in data. Applications for clustering include gene sequence analysis, market research, and object recognition in images.
Understanding which learning technique is best suited for a specific project or application, while important, is only the first step in enabling the capabilities of an integrated Machine Learning system. Choosing the correct learning algorithm and, finally, determining the best time to utilize the technology, round out the process.
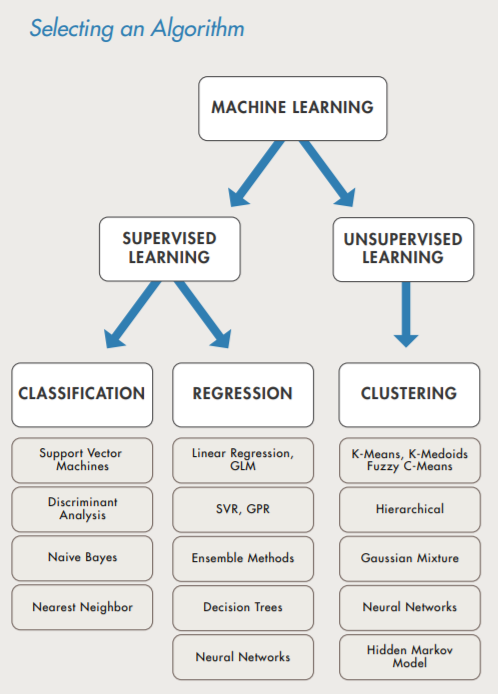
Selecting the Appropriate Algorithm
Choosing the right algorithm can seem overwhelming — there are dozens of supervised and unsupervised Machine Learning algorithms, and each takes a different approach. There is no best method or one size fits all.
Finding the right algorithm is partly trial and error; even highly experienced data scientists can’t tell how well an algorithm will work without trying it out. Algorithm selection also depends on the size and type of data being collected and analyzed, the insights the data is meant to reveal, and how those insights will be used.
Fortunately, Machine Learning and software tools can optimize the algorithm selection process by allowing engineers to explore their data, apply many different models, and more accurately predict how the algorithm will interact with the complete system.
Implementing Machine Learning at the Right Time
After the team has established which algorithm is best suited for a function or project, it will need to consider when to implement the technology. It is best to leverage Machine Learning for problems involving large data sets with lots of variables, and where there is no existing formula or equation. Often, companies rush to select and integrate an algorithm and end up wasting time and resources on a task that does not require the complex technological capabilities of Machine Learning. Instead, Machine Learning should be considered in situations where:
Handwritten rules and equations are too complex, as in face recognition and speech recognition.
The rules of a task are constantly changing, as in fraud detection from transaction records.
The nature of the data keeps changing, and the program needs to adapt, as in automated trading, energy demand forecasting, and predicting shopping trends.
Engineering teams will quickly understand and appreciate the power of Machine Learning if it is implemented correctly and within the right context, such as collecting and analyzing large dynamic data sets. The more complicated the task, the more likely businesses are to benefit.
There’s a good story about bad data from Columbia University. A healthcare project was aimed to cut costs in the treatment of patients with pneumonia. It employed machine learning (ML) to automatically sort through patient records to decide who has the lowest death risk and should take antibiotics at home and who’s at a high risk of death from pneumonia and should be in the hospital. The team used historic data from clinics, and the algorithm was accurate.
But there was with an important exception. One of the most dangerous conditions that may accompany pneumonia is asthma, and doctors always send asthmatics to intensive care resulting in minimal death rates for these patients. So, the absence of asthmatic death cases in the data made the algorithm assume that asthma isn’t that dangerous during pneumonia, and in all cases the machine recommended sending asthmatics home, while they had the highest risk of pneumonia complications.
ML depends heavily on data. It’s the most crucial aspect that makes algorithm training possible and explains why machine learning became so popular in recent years. But regardless of your actual terabytes of information and data science expertise, if you can’t make sense of data records, a machine will be nearly useless or perhaps even harmful.
The thing is, all datasets are flawed. That’s why data preparation is such an important step in the machine learning process. In a nutshell, data preparation is a set of procedures that helps make your dataset more suitable for machine learning. In broader terms, the data prep also includes establishing the right data collection mechanism. And these procedures consume most of the time spent on machine learning. Sometimes it takes months before the first algorithm is built!
Also, check our 14-minute explainer on data preparation:
How data is prepared for machine learning, explained
Dataset preparation is sometimes a DIY project
If you were to consider a spherical machine-learning cow, all data preparation should be done by a dedicated data scientist. And that’s about right. If you don’t have a data scientist on board to do all the cleaning, well… you don’t have machine learning. But as we discussed in our story on data science team structures, life is hard for companies that can’t afford data science talent and try to transition existing IT engineers into the field. Besides, dataset preparation isn’t narrowed down to a data scientist’s competencies only. Problems with machine learning datasets can stem from the way an organization is built, workflows that are established, and whether instructions are adhered to or not among those charged with recordkeeping.
How data science teams work
Yes, you can rely completely on a data scientist in dataset preparation, but by knowing some techniques in advance there’s a way to meaningfully lighten the load of the person who’s going to face this Herculean task.
So, let’s have a look at the most common dataset problems and the ways to solve them.
0. How to collect data for machine learning if you don’t have any
The line dividing those who can play with ML and those who can’t is drawn by years of collecting information. Some organizations have been hoarding records for decades with such great success that now they need trucks to move it to the cloud as conventional broadband is just not broad enough.
For those who’ve just come on the scene, lack of data is expected, but fortunately, there are ways to turn that minus into a plus.
First, rely on open source datasets to initiate ML execution. There are mountains of data for machine learning around and some companies (like Google) are ready to give it away. We’ll talk about public dataset opportunities a bit later. While those opportunities exist, usually the real value comes from internally collected golden data nuggets mined from the business decisions and activities of your own company.
Second – and not surprisingly – now you have a chance to collect data the right way. The companies that started data collection with paper ledgers and ended with .xlsx and .csv files will likely have a harder time with data preparation than those who have a small but proud ML-friendly dataset. If you know the tasks that machine learning should solve, you can tailor a data-gathering mechanism in advance.
What about big data? It’s so buzzed, it seems like the thing everyone should be doing. Aiming at big data from the start is a good mindset, but big data isn’t about petabytes. It’s all about the ability to process them the right way. The larger your dataset, the harder it gets to make the right use of it and yield insights. Having tons of lumber doesn’t necessarily mean you can convert it to a warehouse full of chairs and tables. So, the general recommendation for beginners is to start small and reduce the complexity of their data.
1. Articulate the problem early
Knowing what you want to predict will help you decide which data may be more valuable to collect. When formulating the problem, conduct data exploration and try to think in the categories of classification, clustering, regression, and ranking that we talked about in our whitepaper on business application of machine learning. In layman’s terms, these tasks are differentiated in the following way:
Classification. You want an algorithm to answer binary yes-or-no questions (cats or dogs, good or bad, sheep or goats, you get the idea) or you want to make a multiclass classification (grass, trees, or bushes; cats, dogs, or birds etc.) You also need the right answers labeled, so an algorithm can learn from them. Check our guide on how to tackle data labeling in an organization.
Clustering. You want an algorithm to find the rules of classification and the number of classes. The main difference from classification tasks is that you don’t actually know what the groups and the principles of their division are. For instance, this usually happens when you need to segment your customers and tailor a specific approach to each segment depending on its qualities.
Regression. You want an algorithm to yield some numeric value. For example, if you spend too much time coming up with the right price for your product since it depends on many factors, regression algorithms can aid in estimating this value.
Ranking. Some machine learning algorithms just rank objects by a number of features. Ranking is actively used to recommend movies in video streaming services or show the products that a customer might purchase with a high probability based on his or her previous search and purchase activities.
It’s likely that your business problem can be solved within this simple segmentation and you may start adapting a dataset accordingly. The rule of thumb on this stage is to avoid over-complicated problems.
2. Establish data collection mechanisms
Creating a data-driven culture in an organization is perhaps the hardest part of the entire initiative. We briefly covered this point in our story on machine learning strategy. If you aim to use ML for predictive analytics, the first thing to do is combat data fragmentation.
For instance, if you look at travel tech – one of AltexSoft’s key areas of expertise – data fragmentation is one of the top analytics problems here. In hotel businesses, the departments that are in charge of physical property get into pretty intimate details about their guests. Hotels know guests’ credit card numbers, types of amenities they choose, sometimes home addresses, room service use, and even drinks and meals ordered during a stay. The website where people book these rooms, however, may treat them as complete strangers.
This data gets siloed in different departments and even different tracking points within a department. Marketers may have access to a CRM but the customers there aren’t associated with web analytics. It’s not always possible to converge all data streams into a centralized storage if you have many channels of engagement, acquisition, and retention, but in most cases it’s manageable.
Usually, collecting data is the work of a data engineer, a specialist responsible for creating data infrastructures. But in the early stages, you can engage a software engineer who has some database experience.
Data engineering, explained
There are two major types of data collection mechanisms.
Data Warehouses and ETL
The first one is depositing data in warehouses. These storages are usually created for structured (or SQL) records, meaning they fit into standard table formats. It’s safe to say that all your sales records, payrolls, and CRM data fall into this category. Another traditional attribute of dealing with warehouses is transforming data before loading it there. We’ll talk more about data transformation techniques in this article. But generally it means that you know which data you need and how it must look, so you do all the processing before storing. This approach is called Extract, Transform, and Load (ETL).
The problem with this approach is that you don’t always know in advance which data will be useful and which won’t. So, warehouses are normally used to access data via business intelligence interfaces to visualize the metrics we know we need to track. And there’s another way.
Data Lakes and ELT
Data lakes are storages capable of keeping both structured and unstructured data, including images, videos, sounds records, PDF files… you get the idea. But even if data is structured, it’s not transformed before storing. You would load data there as is and decide how to use and process it later, on demand. This approach is called Extract, Load, and — then when you need — Transform.
More on the difference between ETL and ELT you can find in our article. So, what should you choose? Generally, both. Data lakes are considered a better fit for machine learning. But if you’re confident in at least some data, it’s worth keeping it prepared as you can use it for analytics before you even start any data science initiative.
And keep in mind that modern cloud data warehouse providers support both approaches.
Handling human factor
Another point here is the human factor. Data collection may be a tedious task that burdens your employees and overwhelms them with instructions. If people must constantly and manually make records, the chances are they will consider these tasks as yet another bureaucratic whim and let the job slide. For instance, Salesforce provides a decent toolset to track and analyze salespeople activities but manual data entry and activity logging alienates salespeople.
This can be solved using robotic process automation systems. RPA algorithms are simple, rule-based bots that can do tedious and repetitive tasks.
3. Check your data quality
The first question you should ask — do you trust your data? Even the most sophisticated machine learning algorithms can’t work with poor data. We’ve talked in detail about data quality in a separate article, but generally you should look at several key things.
How tangible is human error? If your data is collected or labeled by humans, check a subset of data and estimate how often mistakes happen.
Were there any technical problems when transferring data? For instance, the same records can be duplicated because of server error, or you had a storage crash, or maybe you experienced a cyberattack. Evaluate how these events impacted your data.
How many omitted values does your data have? While there are ways to handle omitted records, which we discuss below, estimate whether their number is critical.
Is your data adequate to your task? If you’ve been selling home appliances in the US and now plan on branching into Europe, can you use the same data to predict stock and demand?
Is your data imbalanced? Imagine that you’re trying to mitigate supply chain risks and filter out those suppliers that you consider unreliable and you use a number of metadata attributes (e.g., location, size, rating, etc.). If your labeled dataset has 1,500 entries labeled as reliable and only 30 that you consider unreliable, the model won’t have enough samples to learn about the unreliable ones.
4. Format data to make it consistent
Data formatting is sometimes referred to as the file format you’re using. And this isn’t much of a problem to convert a dataset into a file format that fits your machine learning system best.
We’re talking about format consistency of records themselves. If you’re aggregating data from different sources or your dataset has been manually updated by different people, it’s worth making sure that all variables within a given attribute are consistently written. These may be date formats, sums of money (4.03 or $4.03, or even 4 dollars 3 cents), addresses, etc. The input format should be the same across the entire dataset.
And there are other aspects of data consistency. For instance, if you have a set numeric range in an attribute from 0.0 to 5.0, ensure that there are no 5.5s in your set.
5. Reduce data
It’s tempting to include as much data as possible, because of… well, big data! That’s wrong-headed. Yes, you definitely want to collect all data possible. But if you’re preparing a dataset with particular tasks in mind, it’s better to reduce data.
Since you know what the target attribute (what value you want to predict) is, common sense will guide you further. You can assume which values are critical and which are going to add more dimensions and complexity to your dataset without any forecasting contribution.
This approach is called attribute sampling.
For example, you want to predict which customers are prone to make large purchases in your online store. The age of your customers, their location, and gender can be better predictors than their credit card numbers. But this also works another way. Consider which other values you may need to collect to uncover more dependencies. For instance, adding bounce rates may increase accuracy in predicting conversion.
That’s the point where domain expertise plays a big role. Returning to our beginning story, not all data scientists know that asthma can cause pneumonia complications. The same works with reducing large datasets. If you haven’t employed a unicorn who has one foot in healthcare basics and the other in data science, it’s likely that a data scientist might have a hard time understanding which values are of real significance to a dataset.
Another approach is called record sampling. This implies that you simply remove records (objects) with missing, erroneous, or less representative values to make prediction more accurate. The technique can also be used in the later stages when you need a model prototype to understand whether a chosen machine learning method yields expected results and estimate ROI of your ML initiative.
You can also reduce data by aggregating it into broader records by dividing the entire attribute data into multiple groups and drawing the number for each group. Instead of exploring the most purchased products of a given day through five years of online store existence, aggregate them to weekly or monthly scores. This will help reduce data size and computing time without tangible prediction losses.
6. Complete data cleaning
Since missing values can tangibly reduce prediction accuracy, make this issue a priority. In terms of machine learning, assumed or approximated values are “more right” for an algorithm than just missing ones. Even if you don’t know the exact value, methods exist to better “assume” which value is missing or bypass the issue. How to сlean data? Choosing the right approach also heavily depends on data and the domain you have:
Substitute missing values with dummy values, e.g., n/a for categorical or 0 for numerical values
Substitute the missing numerical values with mean figures
For categorical values, you can also use the most frequent items to fill in.
If you use some ML as a service platform, data cleaning can be automated. For instance, Azure Machine Learning allows you to choose among available techniques, while Amazon ML will do it without your involvement at all. Have a look at our MLaaS systems comparison to get a better idea about systems available on the market.
7. Create new features out of existing ones
Some values in your data set can be complex and decomposing them into multiple parts will help in capturing more specific relationships. This process is actually the opposite to reducing data as you have to add new attributes based on the existing ones.
For example, if your sales performance varies depending on the day of a week, segregating the day as a separate categorical value from the date (Mon; 06.19.2017) may provide the algorithm with more relevant information.
8. Join transactional and attribute data
Transactional data consists of events that snapshot specific moments, e.g. what was the price of the boots and the time when a user with this IP clicked on the Buy now button?
Attribute data is more static, like user demographics or age and doesn’t directly relate to specific events.
You may have several data sources or logs where these types of data reside. Both types can enhance each other to achieve greater predictive power. For instance, if you’re tracking machinery sensor readings to enable predictive maintenance, most likely you’re generating logs of transactional data, but you can add such qualities as the equipment model, the batch, or its location to look for dependencies between equipment behavior and its attributes.
Also you can aggregate transactional data into attributes. Say, you gather website session logs to assign different attributes to different users, e.g., researcher (visits 30 pages on average, rarely buys something), reviews reader (explores the reviews page from top to bottom), instant buyer, etc., then you can use this data to, for example, optimize your retargeting campaigns or predict customer lifetime value.
9. Rescale data
Data rescaling belongs to a group of data normalization procedures that aim at improving the quality of a dataset by reducing dimensions and avoiding the situation when some of the values overweight others. What does this mean?
Imagine that you run a chain of car dealerships and most of the attributes in your dataset are either categorical to depict models and body styles (sedan, hatchback, van, etc.) or have 1-2 digit numbers, for instance, for years of use. But the prices are 4-5 digit numbers ($10000 or $8000) and you want to predict the average time for the car to be sold based on its characteristics (model, years of previous use, body style, price, condition, etc.) While the price is an important criterion, you don’t want it to overweight the other ones with a larger number.
In this case, min-max normalization can be used. It entails transforming numerical values to ranges, e.g., from 0.0 to 1.0 where 0.0 represents the minimal and 1.0 the maximum values to even out the weight of the price attribute with other attributes in a dataset.
A bit simpler approach is decimal scaling. It entails scaling data by moving a decimal point in either direction for the same purposes.
10. Discretize data
Sometimes you can be more effective in your predictions if you turn numerical values into categorical values. This can be achieved, for example, by dividing the entire range of values into a number of groups.
If you track customer age figures, there isn’t a big difference between the age of 13 and 14 or 26 and 27. So these can be converted into relevant age groups. Making the values categorical, you simplify the work for an algorithm and essentially make prediction more relevant.
Public datasets
Your private datasets capture the specifics of your unique business and potentially have all relevant attributes that you might need for predictions. But when can you use public datasets?
Public datasets come from organizations and businesses that are open enough to share. The sets usually contain information about general processes in a wide range of life areas like healthcare records, historical weather records, transportation measurements, text and translation collections, records of hardware use, etc. Though these won’t help capture data dependencies in your own business, they can yield great insight into your industry and its niche, and, sometimes, your customer segments.
To learn more about open data sources, consider checking our article about the best public datasets and resources that store this data.
Another use case for public datasets comes from startups and businesses that use machine learning techniques to ship ML-based products to their customers. If you recommend city attractions and restaurants based on user-generated content, you don’t have to label thousands of pictures to train an image recognition algorithm that will sort through photos sent by users. There’s an Open Images dataset from Google. Similar datasets exist for speech and text recognition. You can also find a public datasets compilation on GitHub. Some of the public datasets are commercial and will cost you money.
So, even if you haven’t been collecting data for years, go ahead and search. There may be sets that you can use right away.
A guide to machine learning algorithms and their applications
The term ‘machine learning’ is often, incorrectly, interchanged with Artificial Intelligence[JB1] , but machine learning is actually a sub field/type of AI. Machine learning is also often referred to as predictive analytics, or predictive modelling.
Coined by American computer scientist Arthur Samuel in 1959, the term ‘machine learning’ is defined as a “computer’s ability to learn without being explicitly programmed”.
At its most basic, machine learning uses programmed algorithms that receive and analyse input data to predict output values within an acceptable range. As new data is fed to these algorithms, they learn and optimise their operations to improve performance, developing ‘intelligence’ over time.
There are four types of machine learning algorithms: supervised, semi-supervised, unsupervised and reinforcement.
Supervised learning
In supervised learning, the machine is taught by example. The operator provides the machine learning algorithm with a known dataset that includes desired inputs and outputs, and the algorithm must find a method to determine how to arrive at those inputs and outputs. While the operator knows the correct answers to the problem, the algorithm identifies patterns in data, learns from observations and makes predictions. The algorithm makes predictions and is corrected by the operator – and this process continues until the algorithm achieves a high level of accuracy/performance.
Under the umbrella of supervised learning fall: Classification, Regression and Forecasting.
Classification: In classification tasks, the machine learning program must draw a conclusion from observed values and determine to what category new observations belong. For example, when filtering emails as ‘spam’ or ‘not spam’, the program must look at existing observational data and filter the emails accordingly.
Regression: In regression tasks, the machine learning program must estimate – and understand – the relationships among variables. Regression analysis focuses on one dependent variable and a series of other changing variables – making it particularly useful for prediction and forecasting.
Forecasting: Forecasting is the process of making predictions about the future based on the past and present data, and is commonly used to analyse trends.
Semi-supervised learning
Semi-supervised learning is similar to supervised learning, but instead uses both labelled and unlabelled data. Labelled data is essentially information that has meaningful tags so that the algorithm can understand the data, whilst unlabelled data lacks that information. By using this combination, machine learning algorithms can learn to label unlabelled data.
Unsupervised learning
Here, the machine learning algorithm studies data to identify patterns. There is no answer key or human operator to provide instruction. Instead, the machine determines the correlations and relationships by analysing available data. In an unsupervised learning process, the machine learning algorithm is left to interpret large data sets and address that data accordingly. The algorithm tries to organise that data in some way to describe its structure. This might mean grouping the data into clusters or arranging it in a way that looks more organised.
As it assesses more data, its ability to make decisions on that data gradually improves and becomes more refined.
Under the umbrella of unsupervised learning, fall:
Clustering: Clustering involves grouping sets of similar data (based on defined criteria). It’s useful for segmenting data into several groups and performing analysis on each data set to find patterns.
Dimension reduction: Dimension reduction reduces the number of variables being considered to find the exact information required.
Reinforcement learning
Reinforcement learning focuses on regimented learning processes, where a machine learning algorithm is provided with a set of actions, parameters and end values. By defining the rules, the machine learning algorithm then tries to explore different options and possibilities, monitoring and evaluating each result to determine which one is optimal. Reinforcement learning teaches the machine trial and error. It learns from past experiences and begins to adapt its approach in response to the situation to achieve the best possible result.
What machine learning algorithms can you use?
Choosing the right machine learning algorithm depends on several factors, including, but not limited to: data size, quality and diversity, as well as what answers businesses want to derive from that data. Additional considerations include accuracy, training time, parameters, data points and much more. Therefore, choosing the right algorithm is both a combination of business need, specification, experimentation and time available. Even the most experienced data scientists cannot tell you which algorithm will perform the best before experimenting with others. We have, however, compiled a machine learning algorithm ‘cheat sheet’ which will help you find the most appropriate one for your specific challenges.
What are the most common and popular machine learning algorithms?
Naïve Bayes Classifier Algorithm (Supervised Learning – Classification) The Naïve Bayes classifier is based on Bayes’ theorem and classifies every value as independent of any other value. It allows us to predict a class/category, based on a given set of features, using probability.
Despite its simplicity, the classifier does surprisingly well and is often used due to the fact it outperforms more sophisticated classification methods.
K Means Clustering Algorithm (Unsupervised Learning – Clustering) The K Means Clustering algorithm is a type of unsupervised learning, which is used to categorise unlabelled data, i.e. data without defined categories or groups. The algorithm works by finding groups within the data, with the number of groups represented by the variable K. It then works iteratively to assign each data point to one of K groups based on the features provided.
Support Vector Machine Algorithm (Supervised Learning – Classification) Support Vector Machine algorithms are supervised learning models that analyse data used for classification and regression analysis. They essentially filter data into categories, which is achieved by providing a set of training examples, each set marked as belonging to one or the other of the two categories. The algorithm then works to build a model that assigns new values to one category or the other.
Linear Regression (Supervised Learning/Regression) Linear regression is the most basic type of regression. Simple linear regression allows us to understand the relationships between two continuous variables.
Logistic Regression (Supervised learning – Classification) Logistic regression focuses on estimating the probability of an event occurring based on the previous data provided. It is used to cover a binary dependent variable, that is where only two values, 0 and 1, represent outcomes.
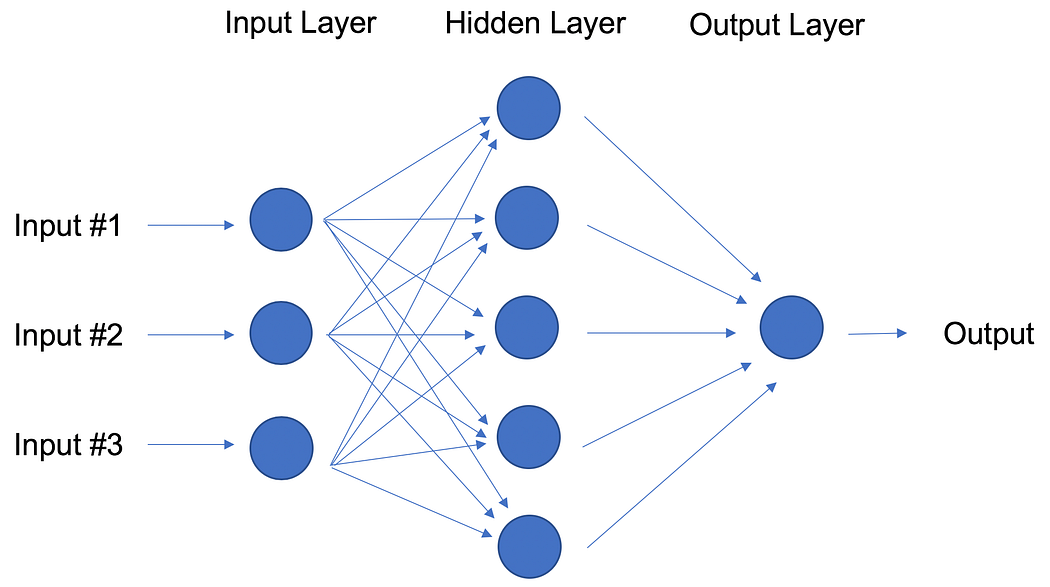
Artificial Neural Networks (Reinforcement Learning) An artificial neural network (ANN) comprises ‘units’ arranged in a series of layers, each of which connects to layers on either side. ANNs are inspired by biological systems, such as the brain, and how they process information. ANNs are essentially a large number of interconnected processing elements, working in unison to solve specific problems.
ANNs also learn by example and through experience, and they are extremely useful for modelling non-linear relationships in high-dimensional data or where the relationship amongst the input variables is difficult to understand.
Decision Trees (Supervised Learning – Classification/Regression) A decision tree is a flow-chart-like tree structure that uses a branching method to illustrate every possible outcome of a decision. Each node within the tree represents a test on a specific variable – and each branch is the outcome of that test.
Random Forests (Supervised Learning – Classification/Regression) Random forests or ‘random decision forests’ is an ensemble learning method, combining multiple algorithms to generate better results for classification, regression and other tasks. Each individual classifier is weak, but when combined with others, can produce excellent results. The algorithm starts with a ‘decision tree’ (a tree-like graph or model of decisions) and an input is entered at the top. It then travels down the tree, with data being segmented into smaller and smaller sets, based on specific variables.
Nearest Neighbours (Supervised Learning) The K-Nearest-Neighbour algorithm estimates how likely a data point is to be a member of one group or another. It essentially looks at the data points around a single data point to determine what group it is actually in. For example, if one point is on a grid and the algorithm is trying to determine what group that data point is in (Group A or Group B, for example) it would look at the data points near it to see what group the majority of the points are in.
Clearly, there are a lot of things to consider when it comes to choosing the right machine learning algorithms for your business’ analytics. However, you don’t need to be a data scientist or expert statistician to use these models for your business. At SAS, our products and solutions utilise a comprehensive selection of machine learning algorithms, helping you to develop a process that can continuously deliver value from your data.
Machine Learning Techniques (like Regression, Classification, Clustering, Anomaly detection, etc.) are used to build the training data or a mathematical model using certain algorithms based upon the computations statistic to make prediction without the need of programming, as these techniques are influential in making the system futuristic, models and promotes automation of things with reduced cost and manpower.
Techniques of Machine Learning
There are a few methods that are influential in promoting the systems to automatically learn and improve as per the experience. But they fall under various categories or types like Supervised Learning, Unsupervised Learning, Reinforcement Learning, Representation Learning, etc. Below are the techniques which fall under Machine Learning:
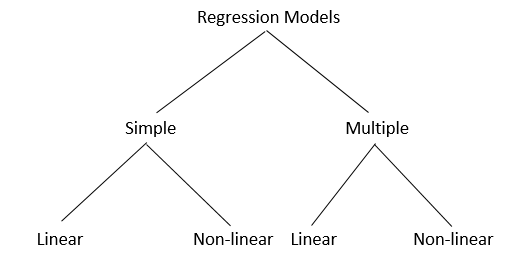
1. Regression
Regression algorithms are mostly used to make predictions on numbers i.e when the output is a real or continuous value. As it falls under Supervised Learning, it works with trained data to predict new test data. For example, age can be a continuous value as it increases with time. There are some Regression models as shown below:
Some widely used algorithms in Regression techniques
Simple Linear Regression Model: It is a statistical method that analyses the relationship between two quantitative variables. This technique is mostly used in financial fields, real estate, etc.
Lasso Regression: Least Absolute Selection Shrinkage Operator or LASSO is used when there is a need for a subset of the predictor to minimize the prediction error in a continuous variable.
Logistic Regression: It is carried out in cases of fraud detection, clinical trials, etc. wherever the output is binary.
Support Vector Regression: SVR is a bit different from SVM. In simple regression, the aim is to minimize the error, while in SVR, we adjust the error within a threshold.
Multivariate Regression Algorithm: This technique is used in the case of multiple predictor variables. It can be operated with matrix operations and Python’s Numpy library.
Multiple Regression Algorithm: It works with multiple quantitative variables in both linear and non-linear regression algorithms.
2. Classification
A classification model, a method of Supervised Learning, draws a conclusion from observed values as one or more outcomes in a categorical form. For example, email has filters like inbox, drafts, spam, etc. There is a number of algorithms in the Classification model like Logistic Regression, Decision Tree, Random Forest, Multilayer Perception, etc. In this model, we classify our data specifically and assign labels accordingly to those classes. Classifiers are of two types:
Binary Classifiers: Classification with 2 distinct classes and 2 output.
Multi-class Classifiers: Classification with more than 2 classes.
3. Clustering
Clustering is a Machine Learning technique that involves classifying data points into specific groups. If we have some objects or data points, then we can apply the clustering algorithm(s) to analyze and group them as per their properties and features. This method of unsupervised technique is used because of its statistical techniques. Cluster algorithms make predictions based on training data and create clusters on the basis of similarity or unfamiliarity.
Clustering methods:
Density-based methods: In this method, clusters are considered dense regions depending on their similarity and difference from the lower dense region.
Hierarchical methods: The clusters formed in this method are the tree-like structures. This method forms trees or clusters from the previous cluster. There are two types of hierarchical methods: Agglomerative (Bottom-up approach) and Divisive (Top-down approach).
Partitioning methods: This method partitions the objects based on k-clusters and each method form a single cluster.
Gris based methods: In this method, data are combined into a number of cells that form a grid-like structure.
4. Anomaly detection
Anomaly detection is the process of detecting unexpected items or events in a data set. Some areas where this technique is used are fraud detection, fault detection, system health monitoring, etc. Anomaly detection can be broadly categorized as:
Point anomalies: Point anomalies are defined when a single data is unexpected.
Contextual anomalies: When anomalies are context-specific, then it’s called contextual anomalies.
Collective anomalies: When a collection or group of related data items are anomalous, then it’s called collective anomalous.
There are certain techniques in Anomaly detection as follows:
Statistical methods: It helps in identifying anomalies by pointing the data that deviates from statistical methods like mean, median, mode, etc.
Density-based anomaly detection: It based on the k-nearest neighbor algorithm.
Clustering-based anomaly algorithm: Data points are collected as a cluster when they fall under the same group and are determined from the local centroids.
Super Vector Machine: The algorithm trains itself to cluster the normal data instances and identifies the anomalies using the training data.
Working on Machine Learning Techniques
Machine Learning utilizes a lot of algorithms to handle and work with large and complex datasets to make predictions as per need.
For example, we search a bus image on Google. So, Google basically gets a number of examples or datasets labeled as bus and the system finds the patterns of pixels and colors that will help in finding correct images of the bus.
Google’s system will make a random guess of the bus like images with the help of patterns. If any mistake occurs, then it adjusts itself for accuracy. In the end, those patterns will be learned by a large computer system modeled like a human brain or Deep Neural Network to identify the accurate results from the images. This is how ML techniques work to get the best result always.
Conclusion
Machine Learning has various applications in real life to help business houses, individuals, etc. to attain certain results as per need. To get the best results, certain techniques are important which have been discussed above. These techniques are modern, futuristic and promote automation of things with less manpower and cost.
In machine learning, the term “learning” refers to the process through which machines examine current data and gain new skills and information from it. Machine learning systems employ algorithms to search for patterns in datasets that may include structured data sets, unorganized textual data, numeric data, or even rich media such as audio files, photos, and videos. Machine learning algorithms are computationally expensive, necessitating the need for specialized infrastructure to run at scale.
What is Machine Learning?
Machine learning is a branch of study that aims to train machines to do cognitive tasks in the same way that humans do. While they have far fewer cognitive abilities than the ordinary person, they are capable of quickly processing large amounts of data and extracting significant commercial insights.
Machine learning algorithms employ computational methods to “learn” information directly from data rather than depending on a model based on a preconceived equation. As the number of samples available for learning grows, the algorithms alter their performance. Deep learning is a type of machine learning that is overspecialized.
As a result, as a machine learning practitioner, you may come across a variety of forms of learning, ranging from entire fields of research to individual methodologies.
( Suggested Read- Basics of Machine Learning )
Different Methods of Machine Learning
The main branches of machine learning are listed below. The majority of machine learning algorithms and techniques fall into one of the following groups of methods:
( Related – Types of Machine Learning Methods )
Supervised Learning
The term “Supervised Learning” refers to a scenario in which a model is used to learn a mapping between input samples and the target variable. If you know what you want to teach a machine beforehand, use Supervised Learning.
This usually entails exposing the algorithm to a large amount of training data, allowing the model to study the output, and fine-tuning the parameters until the desired results are obtained. The machine can then be put to the test by allowing it to generate predictions for a “validation data set,” or new data that hasn’t been seen before.
Un-Supervised Learning
Unsupervised learning allows a machine to study a set of data without the assistance of a human. Following the initial exploration, the computer attempts to uncover hidden patterns that link various variables. This method of learning can assist in the classification of data into categories based solely on statistical attributes.
Unsupervised learning does not require big data sets for training, making it significantly faster and easier to implement than supervised learning. Unsupervised learning, in contrast to supervised learning, is based solely on the input data, with no outputs or target variables. As a result, unlike supervised learning, unsupervised learning does not have a teacher correcting the model.
Semi-Supervised Learning
Semi-supervised learning is supervised learning with a small number of labeled instances and a large number of unlabeled examples in the training data.
In contrast to supervised learning, the purpose of a semi-supervised learning model is to make good use of all available data rather than just the labeled data.
Unsupervised and supervised learning techniques are used in semi-supervised learning. Manually categorizing part of the data, for example, can provide an example to the algorithm for how the rest of the data set should be sorted.
Reinforcement learning
Reinforcement learning is a technique that allows a machine to interact with its surroundings. Playing a video game repeatedly and rewarding the algorithm when it does the required action is a simple example. The machine can eventually learn from its experience by repeating the operation thousands or millions of times. The model has some response from which to learn, similar to supervised learning, albeit the feedback may be delayed and statistically noisy, making it difficult for the agent or model to connect cause and effect.
Playing a game in which the player has the objective of earning a high score and can take actions in the game while receiving feedback in the form of punishments or rewards is an example of a reinforcement problem.
Related blog – What is Supervised, Unsupervised, and Reinforcement Learning
Top Machine Learning Techniques
Now Let’s have a look at some of the most popular machine learning techniques that fall under the above-mentioned categories of Machine learning Methods.
Regression
When the output is a real or continuous value, regression techniques are typically employed to generate predictions on numbers. It uses training data to predict new test data since it falls under the category of Supervised Learning. The purpose of regression techniques is to use a previous data set to explain or forecast a certain numerical result. In the case of retail demand forecasting, regression algorithms can use previous pricing data and anticipate the price of a similar property.
Continuous reactions, such as changes in temperature or fluctuations in power consumption, are predicted using regression algorithms. Electricity load forecasting and algorithmic trading are two examples of typical applications.
If you’re working with a data range or the nature of your response is a real number, such as temperature or the time until a piece of equipment fails, use regression techniques.
The simplest and most fundamental method is linear regression. The following equation is used to model a dataset in this case: ( y = m * x + b )
Multiple pairings of data, such as x, y, can be used to train a regression model. To do so, you must first establish a position for the line, as well as its slope, with a minimum distance from all known data points. This is the line that best approximates the data’s observations and can be used to produce predictions for fresh data that hasn’t been seen before.
According to Educuba, Following are some of the most commonly used algorithms in the Regression Technique.
Simple Linear Regression Model
Lasso Regression
Logistic Regression
Support Vector Regression
Multivariate Regression Algorithm
Multiple Regression Algorithm
( Also Read – Working of Linear and Logistic Regression Model )
Classification
A classification model is a Supervised Learning method that generates a conclusion from observed values as one or more categorical outputs. Many AI applications require classification, but it is especially beneficial for eCommerce applications. Classification algorithms, for example, can aid in predicting whether or not a buyer will purchase a product. In this situation, the two classifications are “yes” and “no.” Classification algorithms are not limited to two classes and can be used to categorize materials into many different groups. The Classification model employs a variety of methods, including Logistic Regression, Multilayer Perception, and others. In this model, we classify our data into distinct categories and assign labels to those categories. There are two types of classifiers:
Classifiers with two unique classifications and two outputs are known as Binary classifiers.
Classifiers having more than two classes are known as Multi-class classifiers.
Clustering
Clustering is a Machine Learning approach for categorizing data points into distinct groups. If we have a set of objects or data points, we can use a clustering method to analyze and group them based on their traits and characteristics. Because of its statistical approaches, this unsupervised procedure is applied. Cluster algorithms use training data to make predictions and form groups based on resemblance or unfamiliarity.
( Related – Applications of Clustering )
Unsupervised learning approaches include clustering algorithms. K-means clustering, mean-shift, and expectation-maximization are three popular clustering techniques. They categorize data points into groups based on features that are similar or shared.
When huge amounts of data need to be segmented or categorized, grouping or clustering techniques are very effective in business applications.
Some of the Clustering Methods are given below-
Density-based methods
Hierarchical methods.
Partitioning methods
Grid-based methods
( Read further on this – Types of Clustering Algorithm )
Decision Tree
It’s a supervised learning algorithm that’s commonly used to solve classification difficulties. It works for both categorical and continuous dependent variables, which is surprising. We divide the population into two or more homogenous sets using this approach. This is done to create as many separate groups as feasible based on the most important attributes/independent variables.
According to MobiDev, The Decision tree algorithm categorizes objects by responding to “questions” regarding their qualities at nodal points. One of the branches is chosen based on the answer, and another question is presented at the next junction until the algorithm reaches the tree’s “leaf,” which represents the ultimate answer.
Knowledge management platforms for customer service, predictive pricing, and product planning are examples of decision tree applications.
( Also Read – Decision Tree in Machine Learning )
Neural Networks
Neural networks are designed to resemble the brain’s structure: each artificial neuron connects to many other neurons, and millions of neurons work together to form a sophisticated cognitive structure. The structure of neural networks is multilayer: neurons in one layer transfer data to many neurons in the next layer, and so on.
The data eventually reaches the output layer, when the network decides how to deal with a problem, categorize an object, and so on. The study of neural networks is characterized as “deep learning” because of its multi-layer structure.
Neural networks can be used for machine translation, fraud detection, and virtual assistant services in the telecoms and media industries. They’re used in the financial industry to detect fraud, manage portfolios, and assess risk.
( Related – Applications of Neural Networks )
Anomaly Detection
The process of recognizing unexpected items or events in a data set is known as anomaly detection. Detection of fraud, failure detection, computer health monitoring, and more applications employ this technology. Anomaly detection can be divided into three categories:
Point anomalies: When a single piece of data is unexpected, this is referred to as a point anomaly.
Contextual anomalies: Contextual anomalies are anomalies that are context-specific.
Collective anomalies: When a group or collection of linked data elements is anomalous, it is referred to as a collective anomaly.
Machine learning is a hot topic in research and industry, with new methodologies developed all the time. The speed and complexity of the field makes keeping up with new techniques difficult even for experts — and potentially overwhelming for beginners.
To demystify machine learning and to offer a learning path for those who are new to the core concepts, let’s look at ten different methods, including simple descriptions, visualizations, and examples for each one.
A machine learning algorithm, also called model, is a mathematical expression that represents data in the context of a problem, often a business problem. The aim is to go from data to insight. For example, if an online retailer wants to anticipate sales for the next quarter, they might use a machine learning algorithm that predicts those sales based on past sales and other relevant data. Similarly, a windmill manufacturer might visually monitor important equipment and feed the video data through algorithms trained to identify dangerous cracks.
The ten methods described offer an overview — and a foundation you can build on as you hone your machine learning knowledge and skill:
Regression
Classification
Clustering
Dimensionality Reduction
Ensemble Methods
Neural Nets and Deep Learning
Transfer Learning
Reinforcement Learning
Natural Language Processing
Word Embeddings
One last thing before we jump in. Let’s distinguish between two general categories of machine learning: supervised and unsupervised. We apply supervised ML techniques when we have a piece of data that we want to predict or explain. We do so by using previous data of inputs and outputs to predict an output based on a new input. For example, you could use supervised ML techniques to help a service business that wants to predict the number of new users who will sign up for the service next month. By contrast, unsupervised ML looks at ways to relate and group data points without the use of a target variable to predict. In other words, it evaluates data in terms of traits and uses the traits to form clusters of items that are similar to one another. For example, you could use unsupervised learning techniques to help a retailer that wants to segment products with similar characteristics — without having to specify in advance which characteristics to use.
Regression
Regression methods fall within the category of supervised ML. They help to predict or explain a particular numerical value based on a set of prior data, for example predicting the price of a property based on previous pricing data for similar properties.
The simplest method is linear regression where we use the mathematical equation of the line (y = m * x + b) to model a data set. We train a linear regression model with many data pairs (x, y) by calculating the position and slope of a line that minimizes the total distance between all of the data points and the line. In other words, we calculate the slope (m) and the y-intercept (b) for a line that best approximates the observations in the data.
Let’s consider a more a concrete example of linear regression. I once used a linear regression to predict the energy consumption (in kWh) of certain buildings by gathering together the age of the building, number of stories, square feet and the number of plugged wall equipment. Since there were more than one input (age, square feet, etc…), I used a multi-variable linear regression. The principle was the same as a simple one-to-one linear regression, but in this case the “line” I created occurred in multi-dimensional space based on the number of variables.
The plot below shows how well the linear regression model fit the actual energy consumption of building. Now imagine that you have access to the characteristics of a building (age, square feet, etc…) but you don’t know the energy consumption. In this case, we can use the fitted line to approximate the energy consumption of the particular building.
Note that you can also use linear regression to estimate the weight of each factor that contributes to the final prediction of consumed energy. For example, once you have a formula, you can determine whether age, size, or height is most important.
Linear Regression Model Estimates of Building’s Energy Consumption (kWh).
Regression techniques run the gamut from simple (like linear regression) to complex (like regularized linear regression, polynomial regression, decision trees and random forest regressions, neural nets, among others). But don’t get bogged down: start by studying simple linear regression, master the techniques, and move on from there.
Classification
Another class of supervised ML, classification methods predict or explain a class value. For example, they can help predict whether or not an online customer will buy a product. The output can be yes or no: buyer or not buyer. But classification methods aren’t limited to two classes. For example, a classification method could help to assess whether a given image contains a car or a truck. In this case, the output will be 3 different values: 1) the image contains a car, 2) the image contains a truck, or 3) the image contains neither a car nor a truck.
The simplest classification algorithm is logistic regression — which makes it sounds like a regression method, but it’s not. Logistic regression estimates the probability of an occurrence of an event based on one or more inputs.
For instance, a logistic regression can take as inputs two exam scores for a student in order to estimate the probability that the student will get admitted to a particular college. Because the estimate is a probability, the output is a number between 0 and 1, where 1 represents complete certainty. For the student, if the estimated probability is greater than 0.5, then we predict that he or she will be admitted. If the estimated probabiliy is less than 0.5, we predict the he or she will be refused.
The chart below plots the scores of previous students along with whether they were admitted. Logistic regression allows us to draw a line that represents the decision boundary.
Logistic Regression Decision Boundary: Admitted to College or Not?
Because logistic regression is the simplest classification model, it’s a good place to start for classification. As you progress, you can dive into non-linear classifiers such as decision trees, random forests, support vector machines, and neural nets, among others.
Clustering
With clustering methods, we get into the category of unsupervised ML because their goal is to group or cluster observations that have similar characteristics. Clustering methods don’t use output information for training, but instead let the algorithm define the output. In clustering methods, we can only use visualizations to inspect the quality of the solution.
The most popular clustering method is K-Means, where “K” represents the number of clusters that the user chooses to create. (Note that there are various techniques for choosing the value of K, such as the elbow method.)
Roughly, what K-Means does with the data points:
Randomly chooses K centers within the data.
Assigns each data point to the closest of the randomly created centers.
Re-computes the center of each cluster.
If centers don’t change (or change very little), the process is finished. Otherwise, we return to step 2. (To prevent ending up in an infinite loop if the centers continue to change, set a maximum number of iterations in advance.)
The next plot applies K-Means to a data set of buildings. Each column in the plot indicates the efficiency for each building. The four measurements are related to air conditioning, plugged-in equipment (microwaves, refrigerators, etc…), domestic gas, and heating gas. We chose K=2 for clustering, which makes it easy to interpret one of the clusters as the group of efficient buildings and the other cluster as the group of inefficient buildings. To the left you see the location of the buildings and to right you see two of the four dimensions we used as inputs: plugged-in equipment and heating gas.
Clustering Buildings into Efficient (Green) and Inefficient (Red) Groups.
As you explore clustering, you’ll encounter very useful algorithms such as Density-Based Spatial Clustering of Applications with Noise (DBSCAN), Mean Shift Clustering, Agglomerative Hierarchical Clustering, Expectation–Maximization Clustering using Gaussian Mixture Models, among others.
Dimensionality Reduction
As the name suggests, we use dimensionality reduction to remove the least important information (sometime redundant columns) from a data set. In practice, I often see data sets with hundreds or even thousands of columns (also called features), so reducing the total number is vital. For instance, images can include thousands of pixels, not all of which matter to your analysis. Or when testing microchips within the manufacturing process, you might have thousands of measurements and tests applied to every chip, many of which provide redundant information. In these cases, you need dimensionality reduction algorithms to make the data set manageable.
The most popular dimensionality reduction method is Principal Component Analysis (PCA), which reduces the dimension of the feature space by finding new vectors that maximize the linear variation of the data. PCA can reduce the dimension of the data dramatically and without losing too much information when the linear correlations of the data are strong. (And in fact you can also measure the actual extent of the information loss and adjust accordingly.)
Another popular method is t-Stochastic Neighbor Embedding (t-SNE), which does non-linear dimensionality reduction. People typically use t-SNE for data visualization, but you can also use it for machine learning tasks like reducing the feature space and clustering, to mention just a few.
The next plot shows an analysis of the MNIST database of handwritten digits. MNIST contains thousands of images of digits from 0 to 9, which researchers use to test their clustering and classification algorithms. Each row of the data set is a vectorized version of the original image (size 28 x 28 = 784) and a label for each image (zero, one, two, three, …, nine). Note that we’re therefore reducing the dimensionality from 784 (pixels) to 2 (dimensions in our visualization). Projecting to two dimensions allows us to visualize the high-dimensional original data set.
t-SNE Iterations on MNIST Database of Handwritten Digits.
Ensemble Methods
Imagine you’ve decided to build a bicycle because you are not feeling happy with the options available in stores and online. You might begin by finding the best of each part you need. Once you assemble all these great parts, the resulting bike will outshine all the other options.
Ensemble methods use this same idea of combining several predictive models (supervised ML) to get higher quality predictions than each of the models could provide on its own. For example, the Random Forest algorithms is an ensemble method that combines many Decision Trees trained with different samples of the data sets. As a result, the quality of the predictions of a Random Forest is higher than the quality of the predictions estimated with a single Decision Tree.
Think of ensemble methods as a way to reduce the variance and bias of a single machine learning model. That’s important because any given model may be accurate under certain conditions but inaccurate under other conditions. With another model, the relative accuracy might be reversed. By combining the two models, the quality of the predictions is balanced out.
The great majority of top winners of Kaggle competitions use ensemble methods of some kind. The most popular ensemble algorithms are Random Forest, XGBoost and LightGBM.
Neural Networks and Deep Learning
In contrast to linear and logistic regressions which are considered linear models, the objective of neural networks is to capture non-linear patterns in data by adding layers of parameters to the model. In the image below, the simple neural net has three inputs, a single hidden layer with five parameters, and an output layer.
Neural Network with One Hidden Layer.
In fact, the structure of neural networks is flexible enough to build our well-known linear and logistic regression. The term Deep learning comes from a neural net with many hidden layers (see next Figure) and encapsulates a wide variety of architectures.
It’s especially difficult to keep up with developments in deep learning, in part because the research and industry communities have doubled down on their deep learning efforts, spawning whole new methodologies every day.
Deep Learning: Neural Network with Many Hidden Layers.
For the best performance, deep learning techniques require a lot of data — and a lot of compute power since the method is self-tuning many parameters within huge architectures. It quickly becomes clear why deep learning practitioners need very powerful computers enhanced with GPUs (graphical processing units).
In particular, deep learning techniques have been extremely successful in the areas of vision (image classification), text, audio and video. The most common software packages for deep learning are Tensorflow and PyTorch.
Transfer Learning
Let’s pretend that you’re a data scientist working in the retail industry. You’ve spent months training a high-quality model to classify images as shirts, t-shirts and polos. Your new task is to build a similar model to classify images of dresses as jeans, cargo, casual, and dress pants. Can you transfer the knowledge built into the first model and apply it to the second model? Yes, you can, using Transfer Learning.
Transfer Learning refers to re-using part of a previously trained neural net and adapting it to a new but similar task. Specifically, once you train a neural net using data for a task, you can transfer a fraction of the trained layers and combine them with a few new layers that you can train using the data of the new task. By adding a few layers, the new neural net can learn and adapt quickly to the new task.
The main advantage of transfer learning is that you need less data to train the neural net, which is particularly important because training for deep learning algorithms is expensive in terms of both time and money (computational resources) — and of course it’s often very difficult to find enough labeled data for the training.
Let’s return to our example and assume that for the shirt model you use a neural net with 20 hidden layers. After running a few experiments, you realize that you can transfer 18 of the shirt model layers and combine them with one new layer of parameters to train on the images of pants. The pants model would therefore have 19 hidden layers. The inputs and outputs of the two tasks are different but the re-usable layers may be summarizing information that is relevant to both, for example aspects of cloth.
Transfer learning has become more and more popular and there are now many solid pre-trained models available for common deep learning tasks like image and text classification.
Reinforcement Learning
Imagine a mouse in a maze trying to find hidden pieces of cheese. The more times we expose the mouse to the maze, the better it gets at finding the cheese. At first, the mouse might move randomly, but after some time, the mouse’s experience helps it realize which actions bring it closer to the cheese.
The process for the mouse mirrors what we do with Reinforcement Learning (RL) to train a system or a game. Generally speaking, RL is a machine learning method that helps an agent learn from experience. By recording actions and using a trial-and-error approach in a set environment, RL can maximize a cumulative reward. In our example, the mouse is the agent and the maze is the environment. The set of possible actions for the mouse are: move front, back, left or right. The reward is the cheese.
You can use RL when you have little to no historical data about a problem, because it doesn’t need information in advance (unlike traditional machine learning methods). In a RL framework, you learn from the data as you go. Not surprisingly, RL is especially successful with games, especially games of “perfect information” like chess and Go. With games, feedback from the agent and the environment comes quickly, allowing the model to learn fast. The downside of RL is that it can take a very long time to train if the problem is complex.
Just as IBM’s Deep Blue beat the best human chess player in 1997, AlphaGo, a RL-based algorithm, beat the best Go player in 2016. The current pioneers of RL are the teams at DeepMind in the UK. More on AlphaGo and DeepMind here.
On April, 2019, the OpenAI Five team was the first AI to beat a world champion team of e-sport Dota 2, a very complex video game that the OpenAI Five team chose because there were no RL algorithms that were able to win it at the time. The same AI team that beat Dota 2’s champion human team also developed a robotic hand that can reorient a block. Read more about the OpenAI Five team here.
You can tell that Reinforcement Learning is an especially powerful form of AI, and we’re sure to see more progress from these teams, but it’s also worth remembering the method’s limitations.
Natural Language Processing
A huge percentage of the world’s data and knowledge is in some form of human language. Can you imagine being able to read and comprehend thousands of books, articles and blogs in seconds? Obviously, computers can’t yet fully understand human text but we can train them to do certain tasks. For example, we can train our phones to autocomplete our text messages or to correct misspelled words. We can even teach a machine to have a simple conversation with a human.
Natural Language Processing (NLP) is not a machine learning method per se, but rather a widely used technique to prepare text for machine learning. Think of tons of text documents in a variety of formats (word, online blogs, ….). Most of these text documents will be full of typos, missing characters and other words that needed to be filtered out. At the moment, the most popular package for processing text is NLTK (Natural Language ToolKit), created by researchers at Stanford.
The simplest way to map text into a numerical representation is to compute the frequency of each word within each text document. Think of a matrix of integers where each row represents a text document and each column represents a word. This matrix representation of the word frequencies is commonly called Term Frequency Matrix (TFM). From there, we can create another popular matrix representation of a text document by dividing each entry on the matrix by a weight of how important each word is within the entire corpus of documents. We call this method Term Frequency Inverse Document Frequency (TFIDF) and it typically works better for machine learning tasks.
Word Embeddings
TFM and TFIDF are numerical representations of text documents that only consider frequency and weighted frequencies to represent text documents. By contrast, word embeddings can capture the context of a word in a document. With the word context, embeddings can quantify the similarity between words, which in turn allows us to do arithmetic with words.
Word2Vec is a method based on neural nets that maps words in a corpus to a numerical vector. We can then use these vectors to find synonyms, perform arithmetic operations with words, or to represent text documents (by taking the mean of all the word vectors in a document). For example, let’s assume that we use a sufficiently big corpus of text documents to estimate word embeddings. Let’s also assume that the words king, queen, man and woman are part of the corpus. Let say that vector(‘word’) is the numerical vector that represents the word ‘word’. To estimate vector(‘woman’), we can perform the arithmetic operation with vectors:
Word representations allow finding similarities between words by computing the cosine similarity between the vector representation of two words. The cosine similarity measures the angle between two vectors.
We compute word embeddings using machine learning methods, but that’s often a pre-step to applying a machine learning algorithm on top. For instance, suppose we have access to the tweets of several thousand Twitter users. Also suppose that we know which of these Twitter users bought a house. To predict the probability of a new Twitter user buying a house, we can combine Word2Vec with a logistic regression.
You can train word embeddings yourself or get a pre-trained (transfer learning) set of word vectors. To download pre-trained word vectors in 157 different languages, take a look at FastText.
Summary
I’ve tried to cover the ten most important machine learning methods: from the most basic to the bleeding edge. Studying these methods well and fully understanding the basics of each one can serve as a solid starting point for further study of more advanced algorithms and methods.
There is of course plenty of very important information left to cover, including things like quality metrics, cross validation, class imbalance in classification methods, and over-fitting a model, to mention just a few. Stay tuned.
All the visualizations of this blog were done using Watson Studio Desktop.
If you’re interested in learning about Data Science, you may be asking yourself – deep learning vs. machine learning, what’s the difference? In this article we’ll cover the two discipline’s similarities, differences, and how they both tie back to Data Science.
Key Takeaways
Deep learning is a type of machine learning, which is a subset of artificial intelligence.
Machine learning is about computers being able to think and act with less human intervention; deep learning is about computers learning to think using structures modeled on the human brain.
Machine learning requires less computing power; deep learning typically needs less ongoing human intervention.
Deep learning can analyze images, videos, and unstructured data in ways machine learning can’t easily do.
Every industry will have career paths that involve machine and deep learning.
What is artificial intelligence (AI)?
Artificial Intelligence (AI) is a science devoted to making machines think and act like humans.
This may sound simple, but no existing computer begins to match the complexities of human intelligence. Computers excel at applying rules and executing tasks, but sometimes a relatively straightforward ‘action’ for a person might be extremely complex for a computer.
For example, carrying a tray of drinks through a crowded bar and serving them to the correct customer is something servers do every day, but it is a complex exercise in decision making and based on a high volume of data being transmitted between neurons in the human brain.
Computers aren’t there yet, but machine learning and deep learning are steps towards a key element of this goal: analyzing large volumes of data and making decisions/predictions based on it with as little human intervention as possible.
What is machine learning?
Machine Learning is a subset of artificial intelligence focusing on a specific goal: setting computers up to be able to perform tasks without the need for explicit programming.
Computers are fed structured data (in most cases) and ‘learn’ to become better at evaluating and acting on that data over time.
Think of ‘structured data’ as data inputs you can put in columns and rows. You might create a category column in Excel called ‘food’, and have row entries such as ‘fruit’ or ‘meat’. This form of ‘structured’ data is very easy for computers to work with, and the benefits are obvious (It’s no coincidence that one of the most important data programming languages is called ‘structured query language’).
Once programmed, a computer can take in new data indefinitely, sorting and acting on it without the need for further human intervention.
Over time, the computer may be able to recognize that ‘fruit’ is a type of food even if you stop labeling your data. This ‘self-reliance’ is so fundamental to machine learning that the field breaks down into subsets based on how much ongoing human help is involved.
Supervised learning & semi-supervised learning
Supervised learning is a subset of machine learning that requires the most ongoing human participation — hence the name ‘supervised’. The computer is fed training data and a model explicitly designed to ‘teach’ it how to respond to the data.
Once the model is in place, more data can be fed into the computer to see how well it responds — and the programmer/data scientist can confirm accurate predictions, or can issue corrections for any incorrect responses. Picture a programmer trying to teach a computer image classification. They’d input images and task the computer to classify each image, confirming or correcting each computer output.
Over time, this level of supervision helps hone the model into something that is accurately able to handle new datasets that follow the ‘learned’ patterns. But it is not efficient to keep monitoring the computer’s performance and making adjustments.
In semi-supervised learning, the computer is fed a mixture of correctly labeled data and unlabeled data, and searches for patterns on its own. The labeled data serves as ‘guidance’ from the programmer, but they do not issue ongoing corrections.
Unsupervised learning
Unsupervised learning takes this a step further by using unlabeled data. The computer is given the freedom to find patterns and associations as it sees fit, often generating results that might have been unapparent to a human data analyst.
A common use for unsupervised learning is ‘clustering’, where the computer organizes the data into common themes and layers it identifies. Shopping/e-commerce websites routinely use this technology to decide what recommendations to make to specific users based on their past purchases.
Reinforcement learning
In supervised and unsupervised learning, there is no ‘consequence’ to the computer if it fails to properly understand or categorize data. But what if, like a child at school, it received positive feedback when it did the right thing, and negative feedback when it did the wrong thing? The computer would presumably begin to figure out how to get specific tasks job done through trial-and-error, knowing it’s on the right track when it receives a reward (for example, a score) that reinforces its ‘good behavior’.
This type of reinforced learning is critical to helping machines master complex tasks that come with large, highly flexible, and unpredictable datasets. This opens the door to computers that are trying to achieve a goal: perform surgery, drive a car, scan luggage for dangerous objects, etc.
What is machine learning used for today?
You might be surprised to find that you interact with machine learning tools every day. Google uses it to filter spam, malware, and attempted phishing emails out of your inbox. Your bank and credit card use it to generate warnings about suspicious transactions on your accounts. When you talk to Siri and Alexa, machine learning drives the voice and speech recognition platforms at work. And when your doctor sends you to a specialist, machine learning may be helping them scan X-rays and blood test results for anomalies like cancer.
As the applications continue to grow, people are turning to machine learning to handle increasingly more complex types of data. There is a strong demand for computers that can handle unstructured data, like images or video. And this is where deep learning enters the picture.
What is deep learning?
Machine learning is about computers being able to perform tasks without being explicitly programmed… but the computers still think and act like machines. Their ability to perform some complex tasks — gathering data from an image or video, for example — still falls far short of what humans are capable of.
Deep learning models introduce an extremely sophisticated approach to machine learning and are set to tackle these challenges because they’ve been specifically modeled after the human brain. Complex, multi-layered “deep neural networks” are built to allow data to be passed between nodes (like neurons) in highly connected ways. The result is a non-linear transformation of the data that is increasingly abstract.
While it takes tremendous volumes of data to ‘feed and build’ such a system, it can begin to generate immediate results, and there is relatively little need for human intervention once the programs are in place.
Types of deep learning algorithms
A growing number of deep learning algorithms make these new goals reachable. We’ll cover two here just to illustrate some of the ways that data scientists and engineers are going about applying deep learning in the field.
Convolutional Neural Networks
Convolutional neural networks are specially built algorithms designed to work with images. The ‘convolution’ in the title is the process that applies a weight-based filter across every element of an image, helping the computer to understand and react to elements within the picture itself.
This can be helpful when you need to scan a high volume of images for a specific item or feature; for example, images of the ocean floor for signs of a shipwreck, or a photo of a crowd for a single person’s face.
This science of computer image/video analysis and comprehension is called ‘computer vision’, and represents a high-growth area in the industry over the past 10 years.
Recurrent Neural Networks
Recurrent neural networks, meanwhile, introduce a key element into machine learning that is absent in simpler algorithms: memory. The computer is able to keep past data points and decisions ‘in mind’, and consider them when reviewing current data – introducing the power of context.
This has made recurrent neural networks a major focus for natural language processing work. Like with a human, the computer will do a better job understanding a section of text if it has access to the tone and content that came before it. Likewise, driving directions can be more accurate if the computer ‘remembers’ that everyone following a recommended route on a Saturday night takes twice as long to get where they are going.
5 key differences between machine learning and deep learning
While there are many differences between these two subsets of artificial intelligence, here are five of the most important:
1. Human Intervention
Machine learning requires more ongoing human intervention to get results. Deep learning is more complex to set up but requires minimal intervention thereafter.
2. Hardware
Machine learning programs tend to be less complex than deep learning algorithms and can often run on conventional computers, but deep learning systems require far more powerful hardware and resources. This demand for power has driven has meant increased use of graphical processing units. GPUs are useful for their high bandwidth memory and ability to hide latency (delays) in memory transfer due to thread parallelism (the ability of many operations to run efficiently at the same time.)
3. Time
Machine learning systems can be set up and operate quickly but may be limited in the power of their results. Deep learning systems take more time to set up but can generate results instantaneously (although the quality is likely to improve over time as more data becomes available).
4. Approach
Machine learning tends to require structured data and uses traditional algorithms like linear regression. Deep learning employs neural networks and is built to accommodate large volumes of unstructured data.
5. Applications
Machine learning is already in use in your email inbox, bank, and doctor’s office. Deep learning technology enables more complex and autonomous programs, like self-driving cars or robots that perform advanced surgery.
The future of machine learning and deep learning
Machine and deep learning will affect our lives for generations to come and virtually every industry will be transformed by their capabilities. Dangerous jobs like space travel or work in harsh environments might be entirely replaced with machine involvement.
At the same time, people will turn to artificial intelligence to deliver rich new entertainment experiences that seem like the stuff of science fiction.
Careers in machine learning and deep learning
It will take the continued efforts of talented individuals to help machine and deep learning achieve their best results. While every field will have its own special needs in this space, there are some key career paths that already enjoy competitive hiring environments.
Data Scientists
Data Scientists work to compose the models and algorithms needed to pursue their industry’s goals. They also oversee the processing and analysis of data generated by the computers. This fast-growing career combines a need for coding expertise (Python, Java, etc.) with a strong understanding of the business and strategic goals of a company or industry.
Average Glassdoor salary: $113k/year
Average ZipRecruiter salary: $120k/year
Machine Learning Engineers
Machine Learning Engineers implement the data scientists’ models and integrate them into the complex data and technological ecosystems of the firm. They are also at the helm for the implementation/programming of automated controls or robots that take actions based on incoming data. This is critical work — the massive volume of data and computer processing power requires a high level of expertise and efficiency to be both cost- and resource-effective.
Average Glassdoor salary: $114k/year
Average ZipRecruiter salary: $131k/year
Computer Vision Specialist
Computer Vision Specialists help computers make sense of 2D or 3D images. They are critical to many practical applications of deep learning, such as augmented and virtual reality spaces. This is just an example of a specific career that exists within the machine learning ecosystem; every industry will have its own specialists to help unite the powers of artificial intelligence with industry goals and technologies.
Average Glassdoor salary: $114k/year
Average ZipRecruiter salary: $96k/year
If you’re curious about pursuing a data science career, our data science course covers entire modules devoted to machine learning, deep learning, and natural language processing. We offer this course both in person and as an online course.
All it takes is some math know-how and familiarity with basic data analysis. Here are some tips for getting accepted into our data science course.