Random Forest is an algorithm for machine learning that is used mostly for classification and regression. It utilizes multiple decision trees to generate more precise and accurate predictions.
This instructor-led, live training (online or onsite) is aimed at data scientists and software engineers who wish to use Random Forest to build machine learning algorithms for large datasets.
By the end of this training, participants will be able to:
Set up the necessary development environment to start building machine learning models with Random forest.
Understand the advantages of Random Forest and how to implement it to resolve classification and regression problems.
Learn how to handle large datasets and interpret multiple decision trees in Random Forest.
Evaluate and optimize machine learning model performance by tuning the hyperparameters.
Format of the Course
Interactive lecture and discussion.
Lots of exercises and practice.
Hands-on implementation in a live-lab environment.
Course Customization Options
To request a customized training for this course, please contact us to arrange.
Course Outline
Introduction
Overview of Random Forest features and advantages
Understanding decision trees and ensemble methods
Getting Started
Setting up the libraries (Numpy, Pandas, Matplotlib, etc.)
How does Machine Learning build a Linear Regression model?
Requirements
Some knowledge of programming in any language is essential.
Description
Machine Learning is becoming ubiquitous across all industries. Already many applications have been identified which use Machine Learning now. Few examples include Spam Detection, Face Recognition, Emotion Analysis, Object Detection, Credit Card Fraud Detection, Weather Prediction, and the list is almost endless. More new applications are being identified by different industries almost everyday.
It is not just about applying superior technology for traditional problems when we apply Machine Learning. It is also about business sense since applying Machine Learning, we can make experiments and applications much more economical.
This course is a result of a discussion among my Project Team from our cohort in IIT, Kanpur learning Cyber Security. We have embarked to create a product for Malware Detection using Machine Learning. While all of us are getting grips on Malware Analysis, the team needed some inputs of Machine Learning. To fill the gap, I conducted some sessions with our Project Team members on Machine Learning. This course is a collection of the recording of these sessions.
This course discusses what are Machine Learning Algorithms. We discuss Random Forest Algorithm and Linear Regression as examples to understand what are models in Machine Learning. We see how to implement such models using Python. During the discussion on the development of the Machine Learning models, we discuss the various steps like Data Preprocessing, Normalisation, Scaling, etc. We touch upon the basics of Neural Network and take a slight deep dive into Regression. The course includes discussion on concepts like what is overfitting, what is hyper-parameter tuning, etc.
This course tries to give an idea for what it takes to create a product which uses Machine Learning. I believe that the discussions can get one started to apply Machine Learning to many problems.
In this blog, we will discuss the top 8 Machine Learning algorithms that will help you to receive and analyze input data to predict output values within an acceptable range
Top 8 machine learning algorithms explained
1. Linear Regression
Linear regression – Machine learning algorithm – Data Science Dojo
Linear regression is a simple machine learning model and chances are you are already aware of it! Do you remember plotting the line y=mx+c in your introductory algebra class? This is an equation of a straight line where m is its gradient and c is the point where the line crosses the y-axis. Using this equation, you’re able to estimate the value of y for any given value of x. Similarly, linear regression involves estimating the relationship between independent variables (x) and a dependent variable(y).
2. Logistic Regression
Logistic regression – Machine learning algorithm – Data Science Dojo
Just like linear regression, logistic regression is a machine learning model used to determine the relationship between a dependent variable and one or more independent variables. However, this model is used for classification analysis. This is because logistic regression predicts the probability of an event occurring. For a probability greater than 0.5, a value of 1 is assigned, and for less than that 0. For example, you can use logistic regression to predict whether a student will pass (1) an exam, or they will fail (0).
3. Decision Trees
Linear regression – Machine learning algorithm – Data Science Dojo
Decision tree is a supervised machine learning model that repeatedly splits the data based on a question corresponding to the features. The model learns the best way to reduce randomness and drafts a decision tree that can be used to predict the category of an item based on answering a selection of questions. For example, in the case of whether it will rain today or not, the questions can be whether it is sunny, did it rain yesterday, whether it is windy, and so on.
4. Random Forest
Random forest – Machine learning algorithm – Data Science Dojo
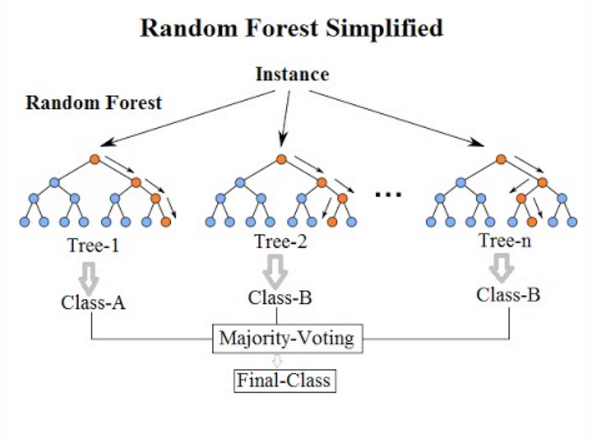
Random Forest is a machine learning algorithm that works similarly to a decision tree. The difference is that random forest uses multiple decision trees to make a prediction and hence decreases overfitting. The process of majority voting is carried out and the class selected by most trees is assigned to an item. For example, if two trees predict it to be 0, and one tree predicts it to be 1, then the class of 0 will be assigned to the item.
5. K-Nearest Neighbor
K-nearest neighbor – Machine learning algorithm – Data Science Dojo
K-Nearest Neighbor is another simple machine learning algorithm that classifies new cases based on the category/class of the data points nearest to the new data point. That is, if most neighbors of an unknown item belong to class 1, then we assign class 1 to this unknown item. The number of neighbors to take into consideration is the value K assigned. If k=10, we will look at the 10 nearest neighbors of this item. The nearest neighbors are determined by measuring the distance using distance measures such as Euclidean distance, and the nearest are those that have the shortest distance.
6. Support Vector Machine
Support vector machine – Machine learning algorithm – Data Science Dojo
Support vector machines by dividing the data points using a hyperplane which is a straight line. The points donated by the blue diamond form one class on the left side of the plane and the points donated by the green circle represent another class on the right side of the plane. If we want to predict the class of a new point, we can simply determine it by whether it lies on the left or right side of the hyperplane and where it is within the margin.
7. K-Means clustering
K-means clustering – Machine learning algorithm
K-means clustering is an unsupervised machine learning algorithm. That means it is used to work with data points whose class is not already known. We can use the clustering algorithm to group similar items into clusters. The number of clusters is determined by the value of K assigned. For example, you assign K=3. Three clusters are selected at random, and we adjust them until they are highly distinct from one another. Distinct clusters will have points similar to each other but these points will be distinct from points in another cluster.
Naïve Bayes is a probabilistic machine learning model based on the Bayes theorem that assumes that all the features are independent of one another. Conditional probability refers to the probability of an outcome occurring if it is given that another event has occurred. This algorithm predicts the probability that an item belongs to a particular class and is assigned the class with the highest probability.
Machine learning (ML) can do everything from analyzing X-rays to predicting stock market prices to recommending binge-worthy television shows. With such a wide range of applications, it’s not surprising that the global machine learning market is projected to grow from $21.7 billion in 2022 to $209.91 billion by 2029, according to Fortune Business Insights.
At the core of machine learning are algorithms, which are trained to become the machine learning models used to power some of the most impactful innovations in the world today.
In this article, you’ll learn about 10 of the most popular machine learning algorithms that you’ll want to know, and explore the different learning styles used to turn machine learning algorithms into functioning machine learning models.
10 machine learning algorithms to know
In simple terms, a machine learning algorithm is like a recipe that allows computers to learn and make predictions from data. Instead of explicitly telling the computer what to do, we provide it with a large amount of data and let it discover patterns, relationships, and insights on its own.
From classification to regression, here are 10 algorithms you need to know in the field of machine learning:
1. Linear regression
Linear regression is a supervised learning algorithm used for predicting and forecasting values that fall within a continuous range, such as sales numbers or housing prices. It is a technique derived from statistics and is commonly used to establish a relationship between an input variable (X) and an output variable (Y) that can be represented by a straight line.
In simple terms, linear regression takes a set of data points with known input and output values and finds the line that best fits those points. This line, known as the “regression line,” serves as a predictive model. By using this line, we can estimate or predict the output value (Y) for a given input value (X).
Linear regression is primarily used for predictive modeling rather than categorization. It is useful when we want to understand how changes in the input variable affect the output variable. By analyzing the slope and intercept of the regression line, we can gain insights into the relationship between the variables and make predictions based on this understanding.
2. Logistic regression
Logistic regression, also known as “logit regression,” is a supervised learning algorithm primarily used for binary classification tasks. It is commonly employed when we want to determine whether an input belongs to one class or another, such as deciding whether an image is a cat or not a cat.
Logistic regression predicts the probability that an input can be categorized into a single primary class. However, in practice, it is commonly used to group outputs into two categories: the primary class and not the primary class. To accomplish this, logistic regression creates a threshold or boundary for binary classification. For example, any output value between 0 and 0.49 might be classified as one group, while values between 0.50 and 1.00 would be classified as the other group.
Consequently, logistic regression is typically used for binary categorization rather than predictive modeling. It enables us to assign input data to one of two classes based on the probability estimate and a defined threshold. This makes logistic regression a powerful tool for tasks such as image recognition, spam email detection, or medical diagnosis where we need to categorize data into distinct classes.
3. Naive Bayes
Naive Bayes is a set of supervised learning algorithms used to create predictive models for binary or multi-classification tasks. It is based on Bayes’ Theorem and operates on conditional probabilities, which estimate the likelihood of a classification based on the combined factors while assuming independence between them.
Let’s consider a program that identifies plants using a Naive Bayes algorithm. The algorithm takes into account specific factors such as perceived size, color, and shape to categorize images of plants. Although each of these factors is considered independently, the algorithm combines them to assess the probability of an object being a particular plant.
Naive Bayes leverages the assumption of independence among the factors, which simplifies the calculations and allows the algorithm to work efficiently with large datasets. It is particularly well-suited for tasks like document classification, email spam filtering, sentiment analysis, and many other applications where the factors can be considered separately but still contribute to the overall classification.
4. Decision tree
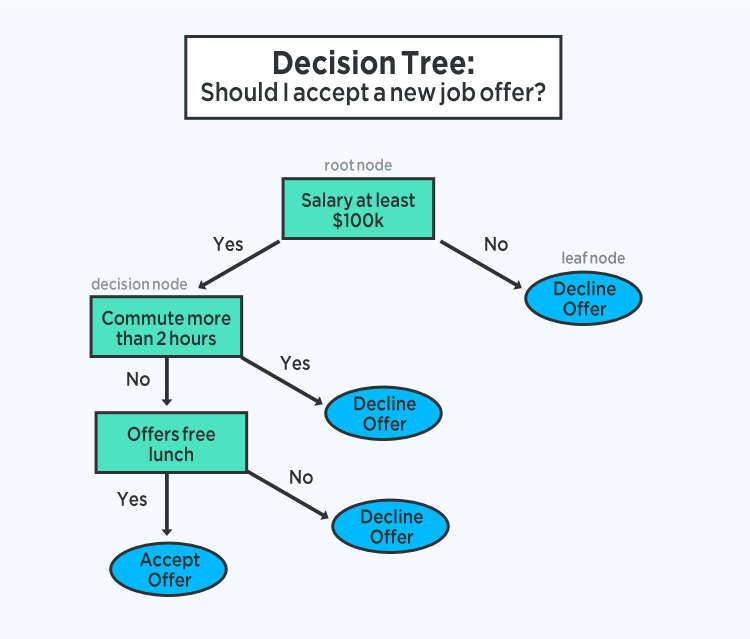
A decision tree is a supervised learning algorithm used for classification and predictive modeling tasks. It resembles a flowchart, starting with a root node that asks a specific question about the data. Based on the answer, the data is directed down different branches to subsequent internal nodes, which ask further questions and guide the data to subsequent branches. This process continues until the data reaches an end node, also known as a leaf node, where no further branching occurs.
Decision tree algorithms are popular in machine learning because they can handle complex datasets with ease and simplicity. The algorithm’s structure makes it straightforward to understand and interpret the decision-making process. By asking a sequence of questions and following the corresponding branches, decision trees enable us to classify or predict outcomes based on the data’s characteristics.
This simplicity and interpretability make decision trees valuable for various applications in machine learning, especially when dealing with complex datasets.
5. Random forest
A random forest algorithm is an ensemble of decision trees used for classification and predictive modeling. Instead of relying on a single decision tree, a random forest combines the predictions from multiple decision trees to make more accurate predictions.
In a random forest, numerous decision tree algorithms (sometimes hundreds or even thousands) are individually trained using different random samples from the training dataset. This sampling method is called “bagging.” Each decision tree is trained independently on its respective random sample.
Once trained, the random forest takes the same data and feeds it into each decision tree. Each tree produces a prediction, and the random forest tallies the results. The most common prediction among all the decision trees is then selected as the final prediction for the dataset.
Random forests address a common issue called “overfitting” that can occur with individual decision trees. Overfitting happens when a decision tree becomes too closely aligned with its training data, making it less accurate when presented with new data.
6. K-nearest neighbor (KNN)
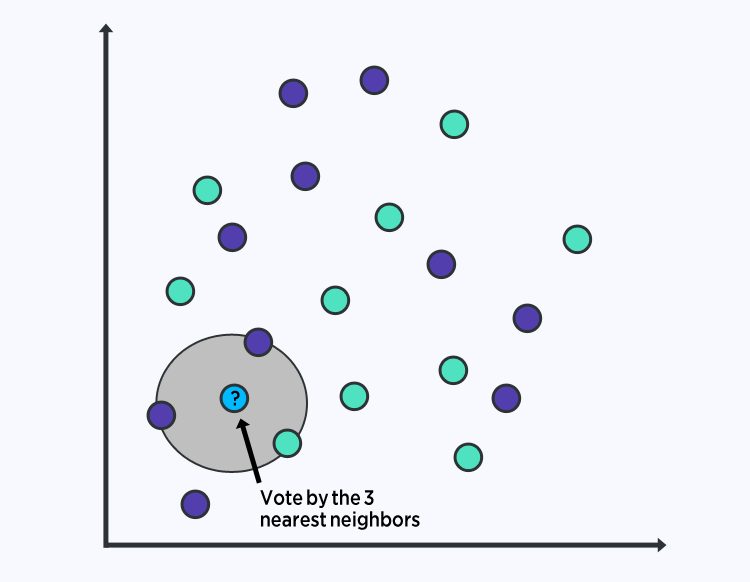
K-nearest neighbor (KNN) is a supervised learning algorithm commonly used for classification and predictive modeling tasks. The name “K-nearest neighbor” reflects the algorithm’s approach of classifying an output based on its proximity to other data points on a graph.
Let’s say we have a dataset with labeled points, some marked as blue and others as red. When we want to classify a new data point, KNN looks at its nearest neighbors in the graph. The “K” in KNN refers to the number of nearest neighbors considered. For example, if K is set to 5, the algorithm looks at the 5 closest points to the new data point.
Based on the majority of the labels among the K nearest neighbors, the algorithm assigns a classification to the new data point. For instance, if most of the nearest neighbors are blue points, the algorithm classifies the new point as belonging to the blue group.
Additionally, KNN can also be used for prediction tasks. Instead of assigning a class label, KNN can estimate the value of an unknown data point based on the average or median of its K nearest neighbors.
7. K-means
K-means is an unsupervised learning algorithm commonly used for clustering and pattern recognition tasks. It aims to group data points based on their proximity to one another. Similar to K-nearest neighbor (KNN), K-means utilizes the concept of proximity to identify patterns or clusters in the data.
Each of the clusters is defined by a centroid, a real or imaginary center point for the cluster. K-means is useful on large data sets, especially for clustering, though it can falter when handling outliers.
K-means is particularly useful for large datasets and can provide insights into the inherent structure of the data by grouping similar points together. It has applications in various fields such as customer segmentation, image compression, and anomaly detection.
8. Support vector machine (SVM)
A support vector machine (SVM) is a supervised learning algorithm commonly used for classification and predictive modeling tasks. SVM algorithms are popular because they are reliable and can work well even with a small amount of data. SVM algorithms work by creating a decision boundary called a “hyperplane.” In two-dimensional space, this hyperplane is like a line that separates two sets of labeled data.
The goal of SVM is to find the best possible decision boundary by maximizing the margin between the two sets of labeled data. It looks for the widest gap or space between the classes. Any new data point that falls on either side of this decision boundary is classified based on the labels in the training dataset.
It’s important to note that hyperplanes can take on different shapes when plotted in three-dimensional space, allowing SVM to handle more complex patterns and relationships in the data.
9. Apriori
Apriori is an unsupervised learning algorithm used for predictive modeling, particularly in the field of association rule mining.
The Apriori algorithm was initially proposed in the early 1990s as a way to discover association rules between item sets. It is commonly used in pattern recognition and prediction tasks, such as understanding a consumer’s likelihood of purchasing one product after buying another.
The Apriori algorithm works by examining transactional data stored in a relational database. It identifies frequent itemsets, which are combinations of items that often occur together in transactions. These itemsets are then used to generate association rules. For example, if customers frequently buy product A and product B together, an association rule can be generated to suggest that purchasing A increases the likelihood of buying B.
By applying the Apriori algorithm, analysts can uncover valuable insights from transactional data, enabling them to make predictions or recommendations based on observed patterns of itemset associations.
10. Gradient boosting
Gradient boosting algorithms employ an ensemble method, which means they create a series of “weak” models that are iteratively improved upon to form a strong predictive model. The iterative process gradually reduces the errors made by the models, leading to the generation of an optimal and accurate final model.
The algorithm starts with a simple, naive model that may make basic assumptions, such as classifying data based on whether it is above or below the mean. This initial model serves as a starting point.
In each iteration, the algorithm builds a new model that focuses on correcting the mistakes made by the previous models. It identifies the patterns or relationships that the previous models struggled to capture and incorporates them into the new model.
Gradient boosting is effective in handling complex problems and large datasets. It can capture intricate patterns and dependencies that may be missed by a single model. By combining the predictions from multiple models, gradient boosting produces a powerful predictive model.
Get started in machine learning
With Machine Learning from DeepLearning.AI on Coursera, you’ll have the opportunity to learn essential machine learning concepts and techniques from industry experts. Develop the skills to build and deploy machine learning models, analyze data, and make informed decisions through hands-on projects and interactive exercises. Not only will you build confidence in applying machine learning in various domains, you could also open doors to exciting career opportunities in data science.
In machine learning, there’s something called the “No Free Lunch” theorem. In a nutshell, it states that no one machine learning algorithm works best for every problem, and it’s especially relevant for supervised learning (i.e. predictive modeling).
For example, you can’t say that neural networks are always better than decision trees or vice versa. There are many factors at play, such as the size and structure of your dataset.
As a result, you should try many different algorithms for your problem, while using a hold-out “test set” of data to evaluate performance and select the winner.
Of course, the algorithms you try must be appropriate for your problem, which is where picking the right machine learning task comes in. As an analogy, if you need to clean your house, you might use a vacuum, a broom, or a mop, but you wouldn’t bust out a shovel and start digging.
THE BIG PRINCIPLE BEHIND MACHINE LEARNING ALGORITHMS
However, there is a common principle that underlies all supervised machine learning algorithms for predictive modeling.
Machine learning algorithms are described as learning a target function (f) that best maps input variables (X) to an output variable (Y): Y = f(X)
This is a general learning task where we would like to make predictions in the future (Y) given new examples of input variables (X). We don’t know what the function (f) looks like or its form. If we did, we would use it directly and we would not need to learn it from data using machine learning algorithms.
The most common type of machine learning is to learn the mapping Y = f(X) to make predictions of Y for new X. This is called predictive modeling or predictive analytics and our goal is to make the most accurate predictions possible.
Most Common Machine Learning Algorithms
For machine learning newbies who are eager to understand the basics of machine learning, here is a quick tour on the top 10 machine learning algorithms used by data scientists.
TOP MACHINE LEARNING ALGORITHMS YOU SHOULD KNOW
Linear Regression
Logistic Regression
Linear Discriminant Analysis
Classification and Regression Trees
Naive Bayes
K-Nearest Neighbors (KNN)
Learning Vector Quantization (LVQ)
Support Vector Machines (SVM)
Random Forest
Boosting
AdaBoost
1. LINEAR REGRESSION
Linear regression is perhaps one of the most well-known and well-understood algorithms in statistics and machine learning.
Predictive modeling is primarily concerned with minimizing the error of a model or making the most accurate predictions possible, at the expense of explainability. We will borrow, reuse and steal algorithms from many different fields, including statistics and use them towards these ends.
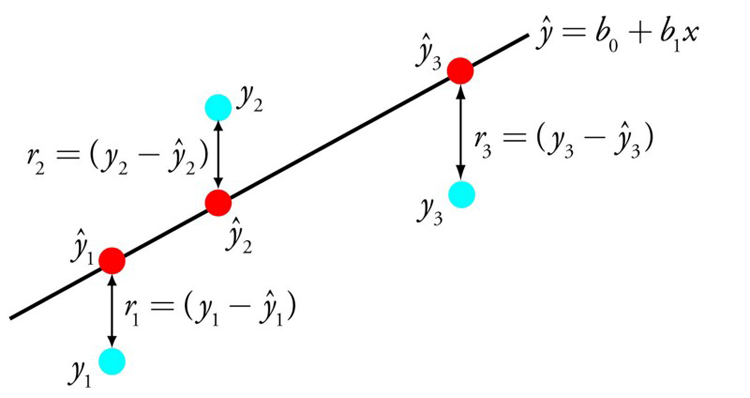
The representation of linear regression is an equation that describes a line that best fits the relationship between the input variables (x) and the output variables (y), by finding specific weightings for the input variables called coefficients (B).
Linear Regression
For example: y = B0 + B1 * x
We will predict y given the input x and the goal of the linear regression learning algorithm is to find the values for the coefficients B0 and B1.
Different techniques can be used to learn the linear regression model from data, such as a linear algebra solution for ordinary least squares and gradient descent optimization.
Linear regression has been around for more than 200 years and has been extensively studied. Some good rules of thumb when using this technique are to remove variables that are very similar (correlated) and to remove noise from your data, if possible. It is a fast and simple technique and a good first algorithm to try.
2. LOGISTIC REGRESSION
Logistic regression is another technique borrowed by machine learning from the field of statistics. It is the go-to method for binary classification problems (problems with two class values).
Logistic regression is like linear regression in that the goal is to find the values for the coefficients that weight each input variable. Unlike linear regression, the prediction for the output is transformed using a nonlinear function called the logistic function.
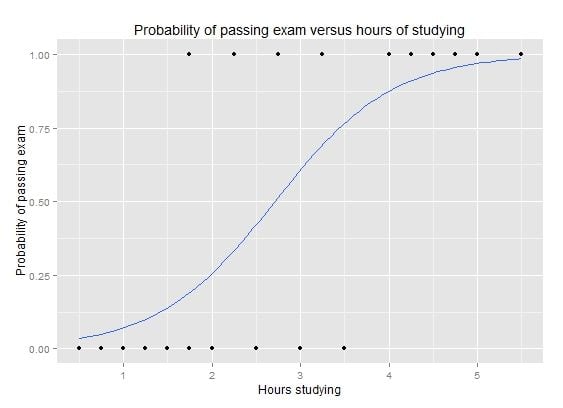
The logistic function looks like a big S and will transform any value into the range 0 to 1. This is useful because we can apply a rule to the output of the logistic function to snap values to 0 and 1 (e.g. IF less than 0.5 then output 1) and predict a class value.
Logistic Regression: Graph of a logistic regression curve showing probability of passing an exam versus hours studying
Because of the way that the model is learned, the predictions made by logistic regression can also be used as the probability of a given data instance belonging to class 0 or class 1. This can be useful for problems where you need to give more rationale for a prediction.
Like linear regression, logistic regression does work better when you remove attributes that are unrelated to the output variable as well as attributes that are very similar (correlated) to each other. It’s a fast model to learn and effective on binary classification problems.
3. LINEAR DISCRIMINANT ANALYSIS
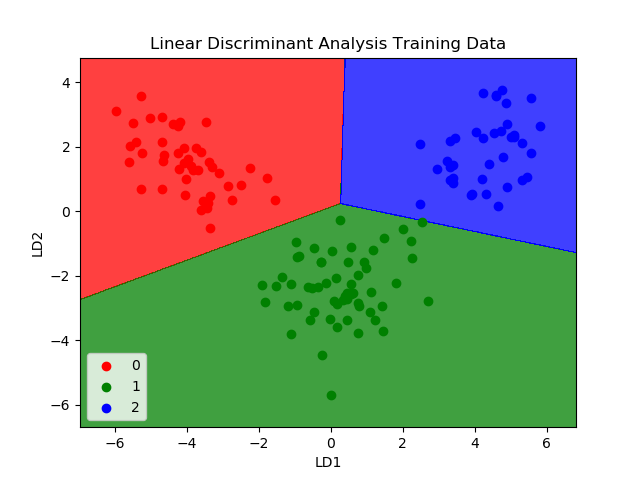
Logistic Regression is a classification algorithm traditionally limited to only two-class classification problems. If you have more than two classes then the Linear Discriminant Analysis algorithm is the preferred linear classification technique.
The representation of LDA is pretty straightforward. It consists of statistical properties of your data, calculated for each class. For a single input variable this includes:
The mean value for each class.
The variance calculated across all classes.
Linear Discriminant Analysis
Predictions are made by calculating a discriminant value for each class and making a prediction for the class with the largest value. The technique assumes that the data has a Gaussian distribution (bell curve), so it is a good idea to remove outliers from your data beforehand. It’s a simple and powerful method for classification predictive modeling problems.
4. CLASSIFICATION AND REGRESSION TREES
Decision trees are an important type of algorithm for predictive modeling machine learning.
The representation of the decision tree model is a binary tree. This is your binary tree from algorithms and data structures, nothing too fancy. Each node represents a single input variable (x) and a split point on that variable (assuming the variable is numeric).
Decision Tree
The leaf nodes of the tree contain an output variable (y) which is used to make a prediction. Predictions are made by walking the splits of the tree until arriving at a leaf node and output the class value at that leaf node.
Trees are fast to learn and very fast for making predictions. They are also often accurate for a broad range of problems and do not require any special preparation for your data.
5. NAIVE BAYES
Naive Bayes is a simple but surprisingly powerful algorithm for predictive modeling.
The model consists of two types of probabilities that can be calculated directly from your training data: 1) The probability of each class; and 2) The conditional probability for each class given each x value. Once calculated, the probability model can be used to make predictions for new data using Bayes Theorem. When your data is real-valued it is common to assume a Gaussian distribution (bell curve) so that you can easily estimate these probabilities.
Naive Bayes: Bayes Theorem
Naive Bayes is called naive because it assumes that each input variable is independent. This is a strong assumption and unrealistic for real data, nevertheless, the technique is very effective on a large range of complex problems.
HIRING NOWView All Remote Data Science Jobs
6. K-NEAREST NEIGHBORS
The KNN algorithm is very simple and very effective. The model representation for KNN is the entire training dataset. Simple right?
Predictions are made for a new data point by searching through the entire training set for the K most similar instances (the neighbors) and summarizing the output variable for those K instances. For regression problems, this might be the mean output variable, for classification problems this might be the mode (or most common) class value.
The trick is in how to determine the similarity between the data instances. The simplest technique if your attributes are all of the same scale (all in inches for example) is to use the Euclidean distance, a number you can calculate directly based on the differences between each input variable.
K-Nearest Neighbors
KNN can require a lot of memory or space to store all of the data, but only performs a calculation (or learn) when a prediction is needed, just in time. You can also update and curate your training instances over time to keep predictions accurate.
The idea of distance or closeness can break down in very high dimensions (lots of input variables) which can negatively affect the performance of the algorithm on your problem. This is called the curse of dimensionality. It suggests you only use those input variables that are most relevant to predicting the output variable.
7. LEARNING VECTOR QUANTIZATION
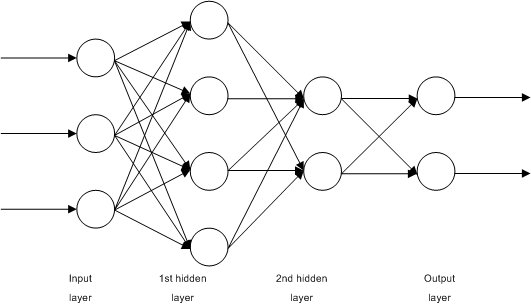
A downside of K-Nearest Neighbors is that you need to hang on to your entire training dataset. The Learning Vector Quantization algorithm (or LVQ for short) is an artificial neural network algorithm that allows you to choose how many training instances to hang onto and learns exactly what those instances should look like.
Learning Vector Quantization
The representation for LVQ is a collection of codebook vectors. These are selected randomly in the beginning and adapted to best summarize the training dataset over a number of iterations of the learning algorithm. After learning, the codebook vectors can be used to make predictions just like K-Nearest Neighbors. The most similar neighbor (best matching codebook vector) is found by calculating the distance between each codebook vector and the new data instance. The class value or (real value in the case of regression) for the best matching unit is then returned as the prediction. Best results are achieved if you rescale your data to have the same range, such as between 0 and 1.
If you discover that KNN gives good results on your dataset try using LVQ to reduce the memory requirements of storing the entire training dataset.
8. SUPPORT VECTOR MACHINES
Support Vector Machines are perhaps one of the most popular and talked about machine learning algorithms.
A hyperplane is a line that splits the input variable space. In SVM, a hyperplane is selected to best separate the points in the input variable space by their class, either class 0 or class 1. In two-dimensions, you can visualize this as a line and let’s assume that all of our input points can be completely separated by this line. The SVM learning algorithm finds the coefficients that result in the best separation of the classes by the hyperplane.
Support Vector Machine
The distance between the hyperplane and the closest data points is referred to as the margin. The best or optimal hyperplane that can separate the two classes is the line that has the largest margin. Only these points are relevant in defining the hyperplane and in the construction of the classifier. These points are called the support vectors. They support or define the hyperplane. In practice, an optimization algorithm is used to find the values for the coefficients that maximizes the margin.
SVM might be one of the most powerful out-of-the-box classifiers and worth trying on your dataset.
9. BAGGING AND RANDOM FOREST
Random forest is one of the most popular and most powerful machine learning algorithms. It is a type of ensemble machine learning algorithm called Bootstrap Aggregation or bagging.
The bootstrap is a powerful statistical method for estimating a quantity from a data sample. Such as a mean. You take lots of samples of your data, calculate the mean, then average all of your mean values to give you a better estimation of the true mean value.
In bagging, the same approach is used, but instead for estimating entire statistical models, most commonly decision trees. Multiple samples of your training data are taken then models are constructed for each data sample. When you need to make a prediction for new data, each model makes a prediction and the predictions are averaged to give a better estimate of the true output value.
Random Forest
Random forest is a tweak on this approach where decision trees are created so that rather than selecting optimal split points, suboptimal splits are made by introducing randomness.
The models created for each sample of the data are therefore more different than they otherwise would be, but still accurate in their unique and different ways. Combining their predictions results in a better estimate of the true underlying output value.
If you get good results with an algorithm with high variance (like decision trees), you can often get better results by bagging that algorithm.
10. BOOSTING AND ADABOOST
Adaboost
Boosting is an ensemble technique that attempts to create a strong classifier from a number of weak classifiers. This is done by building a model from the training data, then creating a second model that attempts to correct the errors from the first model. Models are added until the training set is predicted perfectly or a maximum number of models are added.
AdaBoost was the first really successful boosting algorithm developed for binary classification. It is the best starting point for understanding boosting. Modern boosting methods build on AdaBoost, most notably stochastic gradient boosting machines.
https://www.youtube.com/embed/LsK-xG1cLYA?autoplay=0&start=0&rel=0Explanation of AdaBoost
AdaBoost is used with short decision trees. After the first tree is created, the performance of the tree on each training instance is used to weight how much attention the next tree that is created should pay attention to each training instance. Training data that is hard to predict is given more weight, whereas easy to predict instances are given less weight. Models are created sequentially one after the other, each updating the weights on the training instances that affect the learning performed by the next tree in the sequence. After all the trees are built, predictions are made for new data, and the performance of each tree is weighted by how accurate it was on training data.
Because so much attention is put on correcting mistakes by the algorithm it is important that you have clean data with outliers removed.
Which Machine Learning Algorithm Should I Use?
A typical question asked by a beginner, when facing a wide variety of machine learning algorithms, is “which algorithm should I use?” The answer to the question varies depending on many factors, including: (1) The size, quality, and nature of data; (2) The available computational time; (3) The urgency of the task; and (4) What you want to do with the data.
Even an experienced data scientist cannot tell which algorithm will perform the best before trying different algorithms. Although there are many other machine learning algorithms, these are the most popular ones. If you’re a newbie to machine learning, these would be a good starting point to learn.