Introduction
Alteryx Overview
- What is Alteryx?
- Alteryx features
Preparing the Development Environment
- Installing and configuring Alteryx
Input and Read
- Connecting data sources to Alteryx
- Importing data
- Using the input tool
Data Wrangling
- Using data preparation tools and parsing tools
- Working with joins and unions
Transformations
- Using various pivot methods
- Aggregating data
Layouts
- Reporting layouts
- Exporting reports
Summary and Conclusion
Introduction
Alteryx Overview
- What is Alteryx
- Alteryx features
Preparing the Development Environment
- Installing and configuring Alteryx
- Navigating the interface
Alteryx Quick Start
- Importing data
- Creating and executing a workflow
- Working with documentation tools and cumulative tools
Data Management
- Preparing and cleansing data
Data Wrangling
- Creating custom formulas, algorithms, and calculations
- Performing data transformations
Data visualization
- Integrating a BI platform (Tableau, Power BI, etc.)
- Creating data visualizations
- Automating reporting
Summary and Conclusion

Perform Data Wrangling with the Python Programming Language. Practice and Solution Notebooks included.
Requirements
- You will need to have basic python programming proficiency.
- You will need a modern browser i.e. Google Chrome or Mozilla Firefox.
Description
By the end of this course, you will be able to:
- Load a local dataset from CSV and Excel files.
- Import a dataset from CSV and Excel files via a URL.
- Determine the size of a dataset.
- Explore the first and last records of a dataset.
- Explore the datatypes of the features of a dataset.
- Check for missing data in a dataset.
- Deal with missing data in a dataset.
- Filter for records with certain values from a dataset.
- Filter records with multiple filters from a dataset.
- Filter for records from a dataset through the use of conditions.
- Perform sorting in ascending and descending order.
- Split a column in a dataset.
- Merge data frames to form a dataset.
- Concatenate two columns to one column in a dataset.
- Export a dataset in CSV and Excel formats.
Who this course is for:
- This course is designed for professionals with an interest in getting hands-on experience with the respective data science techniques and tools.
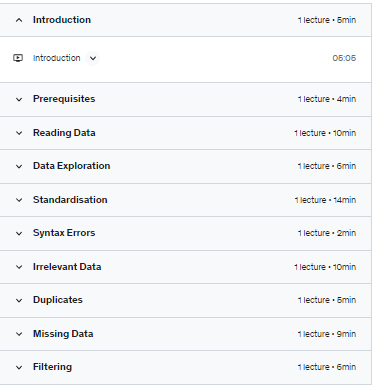
Course content
14 sections • 14 lectures • 1h 23m total lengthExpand all sections