This course is designed for first time python learners. We have created a syllabus which curates for the need of an absolute beginner to Python. We have provided crystal clear explanations and relevant examples wherever needed. This course may help you shape problem solving skill in real life situations.
This course is designed for newbies only. If you are experienced, then this is not for you. Also, if you want to get a job as python developer or want to join internship in python. This course would be helpful for those as well. Feel free to ask if you have any questions. Apart from lectures, I’ll be sharing quizzes later.
If you learn coding, it enhances your personality and also provides you with a new way of looking at things. It enhances your logical reasoning skills. Overall, this course is good for school kids as well.
Once you learn python, it opens the door to many new opportunities like data science, machine learning, data analytics, artificial intelligence, and what not. Grab this opportunity to learn this great language and be awesome.
Note: Nowadays our attention span has reduced drastically. Hence, I would suggest going through each video at least thrice to get optimal benefit out of this course. Keep your pen and paper handy for taking notes or taking down important points.
Data Analytics in Python is a course that focuses on how to use the Python programming language to analyze & visualize
Requirements
Requires a great desire to learn and enter the world of python
Description
Data Analytics with Python is an exciting and challenging course that will teach you how to transform data into valuable insights. In a world where information is a critical resource, data analysis is essential to gain insights, make informed decisions, and improve results.
In this course, you’ll learn how to use the powerful Python programming language to effectively explore, clean, analyze, and visualize data. From manipulating large data sets to creating stunning visualizations, we’ll teach you everything you need to know to become a world-class data analyst.
You will learn to work with tools such as Pandas, Matplotlib, and Seaborn, which are widely used in the industry and allow for fast and efficient data manipulation. This course is perfect for those with an interest in technology, data, and informed decision making. Whether you’re looking for a career change or just want to expand your skills, Data Analytics with Python is an exciting and rewarding course that will take you to a new level in your career. Join us to learn how to transform data into valuable knowledge!
This project that you will develop here will serve for your portfolio of projects and thus be successful in this area.
Large language models have captured the news cycle, but there are many other kinds of machine learning and deep learning with many different use cases.
Amid all the hype and hysteria about ChatGPT, Bard, and other generative large language models (LLMs), it’s worth taking a step back to look at the gamut of AI algorithms and their uses. After all, many “traditional” machine learning algorithms have been solving important problems for decades—and they’re still going strong. Why should LLMs get all the attention?
Before we dive in, recall that machine learning is a class of methods for automatically creating predictive models from data. Machine learning algorithms are the engines of machine learning, meaning it is the algorithms that turn a data set into a model. Which kind of algorithm works best (supervised, unsupervised, classification, regression, etc.) depends on the kind of problem you’re solving, the computing resources available, and the nature of the data.
In the next section, I’ll briefly survey the different kinds of machine learning and the different kinds of machine learning models. Then I’ll discuss 14 of the most commonly used machine learning and deep learning algorithms, and explain how those algorithms relate to the creation of models for prediction, classification, image processing, language processing, game-playing and robotics, and generative AI.
[ Also on InfoWorld: The best software development, cloud computing, data analytics, and machine learning products of 2022 ]
Table of Contents
Kinds of machine learning
Popular machine learning algorithms
Popular deep learning algorithms
Kinds of machine learning
Machine learning can solve non-numeric classification problems (e.g., “predict whether this applicant will default on his loan”) and numeric regression problems (e.g., “predict the sales of food processors in our retail locations for the next three months”). Both kinds of models are primarily trained using supervised learning, which means the training data has already been tagged with the answers.
0 seconds of 30 secondsVolume 0%
Tagging training data sets can be expensive and time-consuming, so supervised learning is often enhanced with semi-supervised learning. Semi-supervised learning applies the supervised learning model from a small tagged data set to a larger untagged data set, and adds whatever predicted data that has a high probability of being correct to the model for further predictions. Semi-supervised learning can sometimes go off the rails, so you can improve the process with human-in-the-loop (HITL) review of questionable predictions.
While the biggest problem with supervised learning is the expense of labeling the training data, the biggest problem with unsupervised learning (where the data is not labeled) is that it often doesn’t work very well. Nevertheless, unsupervised learning does have its uses: It can sometimes be good for reducing the dimensionality of a data set, exploring the data’s patterns and structure, finding groups of similar objects, and detecting outliers and other noise in the data.
The potential of an agent that learns for the sake of learning is far greater than a system that reduces complex pictures to a binary decision (e.g., dog or cat). Uncovering patterns rather than carrying out a pre-defined task can yield surprising and useful results, as demonstrated when researchers at Lawrence Berkeley Lab ran a text processing algorithm (Word2vec) on several million material science abstracts to predict discoveries of new thermoelectric materials.Nominations are open for the 2024 Best Places to Work in IT
Reinforcement learning trains an actor or agent to respond to an environment in a way that maximizes some value, usually by trial and error. That’s different from supervised and unsupervised learning, but is often combined with them. It has proven useful for training computers to play games and for training robots to perform tasks.
Neural networks, which were originally inspired by the architecture of the biological visual cortex, consist of a collection of connected units, called artificial neurons, organized in layers. The artificial neurons often use sigmoid or ReLU (rectified linear unit) activation functions, as opposed to the step functions used for the early perceptrons. Neural networks are usually trained with supervised learning.
Deep learning uses neural networks that have a large number of “hidden” layers to identify features. Hidden layers come between the input and output layers. The more layers in the model, the more features can be identified. At the same time, the more layers in the model, the longer it takes to train. Hardware accelerators for neural networks include GPUs, TPUs, and FPGAs.
Fine-tuning can speed up the customization of models significantly by training a few final layers on new tagged data without modifying the weights of the rest of the layers. Models that lend themselves to fine-tuning are called base models or foundational models.
Vision models often use deep convolutional neural networks. Vision models can identify the elements of photographs and video frames, and are usually trained on very large photographic data sets.
Language models sometimes use convolutional neural networks, but recently tend to use recurrent neural networks, long short-term memory, or transformers. Language models can be constructed to translate from one language to another, to analyze grammar, to summarize text, to analyze sentiment, and to generate text. Language models are usually trained on very large language data sets.
Popular machine learning algorithms
The list that follows is not comprehensive, and the algorithms are ordered roughly from simplest to most complex.
Linear regression
Linear regression, also called least squares regression, is the simplest supervised machine learning algorithm for predicting numeric values. In some cases, linear regression doesn’t even require an optimizer, since it is solvable in closed form. Otherwise, it is easily optimized using gradient descent (see below). The assumption of linear regression is that the objective function is linearly correlated with the independent variables. That may or may not be true for your data.
To the despair of data scientists, business analysts often blithely apply linear regression to prediction problems and then stop, without even producing scatter plots or calculating correlations to see if the underlying assumption is reasonable. Don’t fall into that trap. It’s not that hard to do your exploratory data analysis and then have the computer try all the reasonable machine learning algorithms to see which ones work the best. By all means, try linear regression, but treat the result as a baseline, not a final answer.
Gradient descent
Optimization methods for machine learning, including neural networks, typically use some form of gradient descent algorithm to drive the back propagation, often with a mechanism to help avoid becoming stuck in local minima, such as optimizing randomly selected mini-batches (stochastic gradient descent) and applying momentum corrections to the gradient. Some optimization algorithms also adapt the learning rates of the model parameters by looking at the gradient history (AdaGrad, RMSProp, and Adam).
Logistic regression
Classification algorithms can find solutions to supervised learning problems that ask for a choice (or determination of probability) between two or more classes. Logistic regression is a method for solving categorical classification problems that uses linear regression inside a sigmoid or logit function, which compresses the values to a range of 0 to 1 and gives you a probability. Like linear regression for numerical prediction, logistic regression is a good first method for categorical prediction, but shouldn’t be the last method you try.
Support vector machines
Support vector machines (SVMs) are a kind of parametric classification model, a geometric way of separating and classifying two label classes. In the simplest case of well-separated classes with two variables, an SVM finds the straight line that best separates the two groups of points on a plane.
In more complicated cases, the points can be projected into a higher-dimensional space and the SVM finds the plane or hyperplane that best separates the classes. The projection is called a kernel, and the process is called the kernel trick. After you reverse the projection, the resulting boundary is often nonlinear.
When there are more than two classes, SVMs are used on the classes pairwise. When classes overlap, you can add a penalty factor for points that are misclassified; this is called a soft margin.
Decision tree
Decision trees (DTs) are a non-parametric supervised learning method used for both classification and regression. The goal is to create a model that predicts the value of a target variable by learning simple decision rules inferred from the data features. A tree can be seen as a piecewise constant approximation.
Decision trees are easy to interpret and cheap to deploy, but computationally expensive to train and prone to overfitting.
Random forest
The random forest model produces an ensemble of randomized decision trees, and is used for both classification and regression. The aggregated ensemble either combines the votes modally or averages the probabilities from the decision trees. Random forest is a kind of bagging ensemble.
XGBoost
XGBoost (eXtreme Gradient Boosting) is a scalable, end-to-end, tree-boosting system that has produced state-of-the-art results on many machine learning challenges. Bagging and boosting are often mentioned in the same breath. The difference is that instead of generating an ensemble of randomized trees (RDFs), gradient tree boosting starts with a single decision or regression tree, optimizes it, and then builds the next tree from the residuals of the first tree.
K-means clustering
The k-means clustering problem attempts to divide n observations into k clusters using the Euclidean distance metric, with the objective of minimizing the variance (sum of squares) within each cluster. It is an unsupervised method of vector quantization, and is useful for feature learning, and for providing a starting point for other algorithms.
Lloyd’s algorithm (iterative cluster agglomeration with centroid updates) is the most common heuristic used to solve the problem. It is relatively efficient, but doesn’t guarantee global convergence. To improve that, people often run the algorithm multiple times using random initial cluster centroids generated by the Forgy or random partition methods.
K-means assumes spherical clusters that are separable so that the mean converges towards the cluster center, and also assumes that the ordering of the data points does not matter. The clusters are expected to be of similar size, so that the assignment to the nearest cluster center is the correct assignment.
Principal component analysis
Principal component analysis (PCA) is a statistical procedure that uses an orthogonal transformation to convert a set of observations of possibly correlated numeric variables into a set of values of linearly uncorrelated variables called principal components. Karl Pearson invented PCA in 1901. PCA can be accomplished by eigenvalue decomposition of a data covariance (or correlation) matrix, or singular value decomposition (SVD) of a data matrix, usually after a normalization step applied to the initial data.
Popular deep learning algorithms
There are a number of very successful and widely adopted deep learning paradigms, the most recent being the transformer architecture behind today’s generative AI models.
Convolutional neural networks
Convolutional neural networks (CNNs) are a type of deep neural network often used for machine vision. They have the desirable property of being position-independent.
The understandable summary of a convolution layer when applied to images is that it slides over the image spatially, computing dot products; each unit in the layer shares one set of weights. A convnet typically uses multiple convolution layers, interspersed with activation functions. CNNs can also have pooling and fully connected layers, although there is a trend toward getting rid of these types of layers.
Recurrent neural networks
While convolutional neural networks do a good job of analyzing images, they don’t really have a mechanism that accounts for time series and sequences, as they are strictly feed-forward networks. Recurrent neural networks (RNNs), another kind of deep neural network, explicitly include feedback loops, which effectively gives them some memory and dynamic temporal behavior and allows them to handle sequences, such as speech.
That doesn’t mean that CNNs are useless for natural language processing; it does mean that RNNs can model time-based information that escapes CNNs. And it doesn’t mean that RNNs can only process sequences. RNNs and their derivatives have a variety of application areas, including language translation, speech recognition and synthesis, robot control, time series prediction and anomaly detection, and handwriting recognition.
While in theory an ordinary RNN can carry information over an indefinite number of steps, in practice it generally can’t go many steps without losing the context. One of the causes of the problem is that the gradient of the network tends to vanish over many steps, which interferes with the ability of a gradient-based optimizer such as stochastic gradient descent (SGD) to converge.
Long short-term memory
Long short-term memory networks (LSTMs) were explicitly designed to avoid the vanishing gradient problem and allow for long-term dependencies. The design of an LSTM adds some complexity compared to the cell design of an RNN, but works much better for long sequences.
What is Machine Learning and Machine Learning Techniques: Complete Guide
The process of analyzing data and finding patterns in it to be used for meeting business goals is a generalized way of defining data analytics. But with the flow of data into enterprises growing exponentially over the years, it has become difficult to analyze data by using just the traditional statistical methods. Also, the vast amounts of data make it almost impossible for human analysts to spot patterns.
That hurdle, however, can now be crossed by introducing machine learning (ML), a subset of artificial intelligence (AI) in data analytics.
Machine learning techniques help automate the process of data analysis by building efficient algorithms (or models) that can unravel the hidden patterns and insights from data.
Table of Contents
What Is Data Analytics?
What Is Artificial Intelligence
What Is Machine Learning
Machine Learning Today
How Machine Learning Works In Data Analytics
Top 10 Machine Learning Techniques You Should Be Aware Of
What Is Machine Learning Used For In Data Analytics
Who Is Using Machine Learning In Data Analytics?
Challenges and Opportunities in Machine Learning
What is Data Analytics?
The analysis of data is a multi-step process that eventually ends in visualizing data to infer insights from the results. Such analytics is today used across almost every industry — in banking, marketing, and stock markets — to name a few.
What is big data machine learning? Once big data — structured and unstructured data — is collected by an enterprise, it has to be analyzed for patterns and insights. This leads to better decision-making within an organization. Compared to the earlier days, this is also a scientific, evidence-based way of doing business. Big data analysis offers interaction with data that was not possible with the earlier, traditional enterprise business intelligence systems.
Data analytics can be used by businesses in their marketing and sales activities for targeting leads, prospects, and customers with cross-selling and upselling offers.
What is Artificial Intelligence
Artificial intelligence is a very broad-based discipline that mimics human intelligence and can be used to describe anything from automation to robotics.
AI aims at making a machine more “intelligent” by imparting to it the ability to learn from data.
AI is broadly classified into four different types:
Reactive Machines AI: This type of AI includes machines that operate solely based on the present data, considering only the current situation. Reactive AI machines cannot form inferences from the data to evaluate their future actions and can perform a narrower range of pre-defined tasks. Ex — Any Chess Engine, like Deep Blue
Limited Memory AI: Limited Memory AI can make informed and improved decisions by studying past data from its memory. Such an AI has a short-lived or temporary memory that can be used to store past experiences and hence evaluate future actions. Ex – Self-driving cars
Theory of Mind AI: The Theory Of Mind AI is a more advanced type of Artificial Intelligence. This category of machines is speculated to play a major role in psychology and focus mainly on emotional intelligence so that human beliefs and thoughts can be better understood
Self-aware AI: In this type of AI, machines have their consciousness and can take decisions independently — like any human being. But this is a very advanced stage of AI
What is Machine Learning
Machine learning is a subset of AI with the narrow purpose of learning from information (data) as far as possible without explicit programming. ML utilizes numerical and statistical approaches to encode learning in models. Machine learning in data analytics is the new way of designing algorithms that learn on their own from data and adapt with minimal human intervention.
An example would be such a model understanding the difference between a $10 temporary fluctuation and a $100 jump in the price of a company share at any given trading hour. The ML algorithm is called a model, and the aim, like in traditional data analytics, is to go from data to insights. An example of machine learning (ML) in day-to-day life is the auto-segregation of spammy emails in your ‘Spam’ folder in your email inbox.
Machine Learning Today
Is machine learning (ML) a new discipline? The answer is no. AI has been around for years but has become commercial only recently. That’s because of advancement in technologies, which has made computing faster and also removed the cost barrier to deployment. Recent iterations of ML can apply complex mathematical calculations to data faster.
In ML, machines are trained to make computations through repeated usage. They are used to build and automate data analytics models and given tasks such as classification, clustering, and divergence detection. The idea is to see if computers can learn from data. As ML models progress, they are monitored to check whether the machines are learning independently when exposed to new data.
There is a subset of ML even called “Deep Learning” where such artificial programs, by working on vast amounts of data, uncover newer patterns, through the help of neural networks. The concept of Neural Networks is inspired by the neurons of the human brain. Deep learning technologies have proved to be very successful in solving complex problems, that traditional ML algorithms can take a long time to solve, and with a lot of fine-tuning.
One more example of machine learning (ML) in action today is the recommendation engines of Netflix or Amazon Prime that throw up movie recommendations for their viewers.
How Machine Learning Works in Data Analytics
As compared to traditional data analytics, machine learning in data analytics is an entirely different process. It automates the entire data analysis workflow to provide a more comprehensive set of insights.
Analytics tools like those running on ML are capable of performing the actual laborious work required for data analytics that was once the task of humans. Mostly, in an unsupervised or semi-supervised manner. Yet, let’s not forget that even in such machine-learning models, it is humans who extract the results of data analysis at the end of the day.
Starting, with machine learning in data analytics, most of the algorithms are either classification-based — where machines classify data — or regression-based, where they forecast values.
Then, there are the two popular machine learning methods that are often deployed by enterprises — supervised and unsupervised algorithms. Supervised ML algorithms provide class labels for each sample data on the training set. In an unsupervised machine-learning algorithm though, no class labels are provided for the training samples. These are the two most popular methods of machine learning. Apart from that, we have a semi-supervised method, which combines a small amount of labeled data with a large amount of unlabeled data during training.
Supervised learning algorithms:
Training is imparted on input-output pair examples utilizing labels like an input where the resultant output (target variable) is also known
Data points are labeled here
The “learning” algorithm then gets a set of inputs along with the compatible correct outputs
This helps the algorithm learn by matching its own actual output with the right set of outputs to find mistakes
When given additional unlabeled data, it utilizes methods like classification, regression, prediction, and gradient boosting, to predict the corresponding label values
Usually used to predict future events based on historical data
The term supervised is used because the data used to train the model already contains the correct answers mapped with every data record, like a teacher supervising the learning of a student
Unsupervised learning algorithm:
As compared to its cousin, here the data used for training has no output labels mapped; there’s no “right” output to match the result with
Unsupervised learning is a type of machine learning algorithm used to draw inferences from datasets consisting of input data without labeled responses
Human intervention is almost nil or minimal
It is left to the algorithm to pretty much figure out things, and to model the underlying structure or distribution in the data to learn more about the data
The “answer” to the problem is not fed into the machine
Used mostly in unstructured data to find some patterns within
In marketing, such an unsupervised model works, for example, to segment customers. Also used to identify data outliers.
The most common unsupervised learning method is cluster analysis, which is used for exploratory data analysis to find hidden patterns or grouping in data
Semi-supervised learning:
The disadvantage of any supervised learning algorithm is that the dataset has to be hand-labeled either by a data set or accumulated historical data. This is a very costly process, especially when dealing with large volumes of data
The most basic disadvantage of any unsupervised learning is that its application spectrum is limited
To overcome this, a new concept of “Semi-Supervised Learning”, usually trained on a combination of small amounts of labeled data and large amounts of unlabeled data
The basic process first involves clustering similar data and using the labeled data to label the rest of the unlabeled data
Inelasticity is again the machine that finds out the cause behind the result. It will try to understand which factor is credited with which outcome
As you may have realized by now, machine learning in data analytics involves the use of techniques such as clustering, elasticity, and natural language. In clustering, it is for the machine to decide the commonalities between the different datasets to understand how certain things are alike.
Natural language, of course, as we have explained before, is for ease of use for normal business users and not coders or analysts. One does not need to know coding language to perform deep analysis. Queries of your data can be made of machines in any human language.
As we said earlier in this guide, machine learning involves building automated models for data analytics. This means machines are tasked with classification, clustering, and anomaly detection. In some algorithms, without relying on programming, algorithms decide the output on the detection of any change in a pattern.
Top 10 Machine Learning Techniques You Should be Aware of
Here are a few Machine Learning Techniques or methods you must be aware of as a data scientist.
Clustering
Distribution-based clustering
Centroid-based clustering
Connectivity-based Clustering
Density-based Clustering
Linear Regression
Logistic Regression
Decision-tree
Categorical Variable Decision Tree
Continuous Variable Decision Tree
While there is a clutch of machine learning algorithms out there, let’s look at some basic and popular ones.
Clustering
This falls under the category of unsupervised ML. Here, the aim is to group (cluster) people, objects, trends, etc., exhibiting similar characteristics. The model does not require output information while in training.
Here the target is to recognize different patterns present in the data and come up with clusters that have very little variation within themselves. But there should be a high variation between the clusters so that each of the clusters can be identified separately. An example would be developing an algorithm that puts those customers who have always bought red Tees into one cluster and then testing other products with this group to understand what grabs their attention.
Simply put, clustering is the recognition of similarities. One must understand that deep learning does not always require labels to find similarities. When there are no labels provided to learn from, it uses machine learning to learn on its own — which means unsupervised learning. This retains the potential of producing highly accurate models. Examples of clustering can be customer churn.
There are mainly two types of clustering approaches — Hard Clustering and Soft Clustering
In Hard Clustering, a data point (or sample) can belong to only one cluster, out of all the pre-defined clusters. But in Soft Clustering, the output is provided as a likelihood (probability) of a data point belonging to each of the pre-defined clusters. A data point is placed under that cluster which shows the maximum likelihood of containing that data point.
Let’s have a look at the different clustering techniques:
Distribution-based clustering
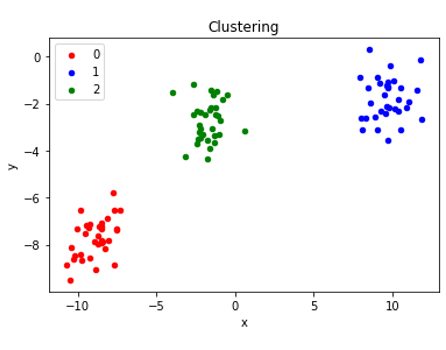
Here the data points are classified in the same cluster if they belong to the same distribution. The most popular choice for this purpose is the Normal (or Gaussian) Distribution. The Gaussian Mixture Model (GMM), a well-known clustering algorithm, falls under this category. GMM models the data with a fixed number of Gaussian distributions and over repeated iterations, it tries to find out the best set of hyper-parameters that would cluster the data points with minimum error. It uses a statistical algorithm called Expectation-Maximization for this purpose.
Centroid-based clustering
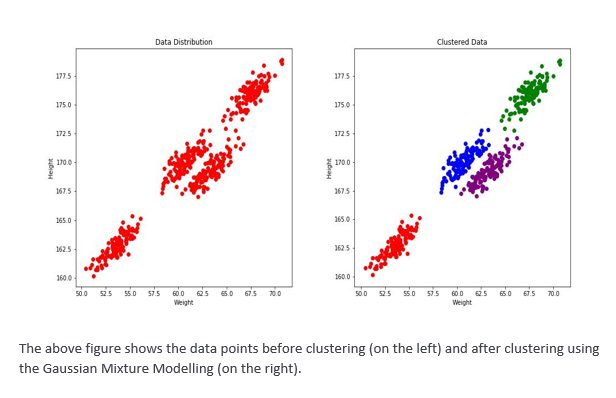
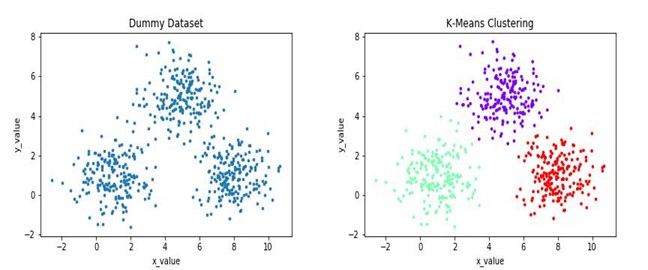
It is basically a Partition based Clustering technique where the number of clusters should be known beforehand. The K-means algorithm, one of the most popular clustering algorithms, falls under this category. Here K stands for the number of clusters. In this algorithm, K data points are chosen randomly from the data set, which is assumed to be the centroids. Those K centroids are initially taken as the K clusters. Using those K clusters, the rest of the data points are classified under that cluster to which it lies the closest.
Obviously, we need a distance function to measure the closeness of the data points from the chosen clusters. So the choice of distance function becomes very important here. The algorithm proceeds over several iterations (which can be set beforehand) and in each iteration, when a new data point is added to a cluster, the cluster mean gets updated accordingly.
The above image shows a dummy dataset and the results obtained after K-Means clustering. Other variations of K-Means include the K-Medoids algorithm, K-Means++, Weighted K-Means, etc.
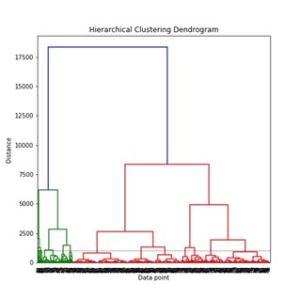
Connectivity-based Clustering
This algorithm is one type of Hierarchical Clustering, where data points that are more “similar” to one another should be clustered in the same group. The main idea of Connectivity based model is similar to Centroid-based model, but they differ in the way of how the distance metric is computed. Apart from the popular distance functions like Euclidean, Manhattan, Cosine, etc. this type of clustering uses a concept called “linkage”, which is another way of defining the distance between two clusters. There are 3 types of Linkage algorithms — Single, Complete, and Average.
The Single Linkage technique merges two clusters if the minimum distance, computed over all possible pairs of points in these two clusters, lies below a pre-specified distance threshold.
The Complete Linkage technique merges two clusters if the maximum distance, computed over all possible pairs of points in these two clusters, lies below a pre-specified distance threshold.
The Average Linkage technique merges two clusters if the average distance, computed over all possible pairs of points in these two clusters, lies below a pre-specified distance threshold.
The above image depicts how connectivity-based clustering clusters (or connects) data points that are similar to each other. The above diagram is known as a Dendrogram.
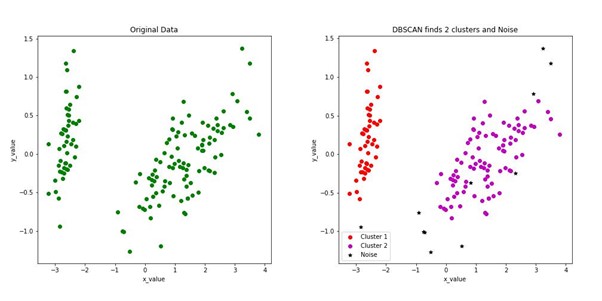
Density-based Clustering
In this clustering model, the data space is searched for areas of varied densities, and data points belonging to similar densities are grouped. There are many advantages of this technique, one of which includes preventing the formation of strip-like clusters that occurs when clusters are grouped based on distance threshold, but they are actually different. This is known as the chaining effect. DBSCAN and OPTICS are the two most popular algorithm that falls under this category.
The complexity of DBSCAN is quite low, although it proves to be efficient in many cases. The above image is obtained after applying the DBSCAN algorithm to a dummy dataset. DBCAN identifies the clusters with good accuracy, and also some noisy points in the dataset, that are not part of any cluster.
Linear Regression
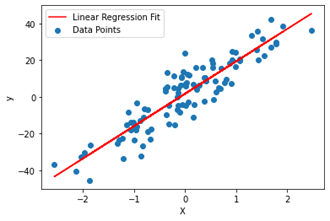
This type of modeling is best suited for finding correlations between variables in data analysis. It is also the most popular machine learning algorithm because of its ease of use. This machine-learning algorithm consists of fitting the dataset in a linear equation that combines a specific set of input variables (x) to the solution of the predicted output for that set of inputs (y). A specific coefficient in the form of a scalar value is assigned to each input variable by the equation.
Linear regression modeling is based on regression capabilities that change depending on the number of independent variables and the type of relationship between the independent and dependent variables. There are two types of linear regression models: simple and multiple linear.
The first is a kind of regression analysis where we find a linear relationship between a single independent (input) variable and a single dependent (output) variable and the second involves two or more independent variables and one dependent variable.
The following graph represents a simple linear regression fit between an input variable(x) and output variable (y).
Logistic Regression
Linear regression algorithms look for correlations between continuous variables innately. On the other hand, logistic regression is used for classifying categorical data. It is yet another technique borrowed from the field of statistics.
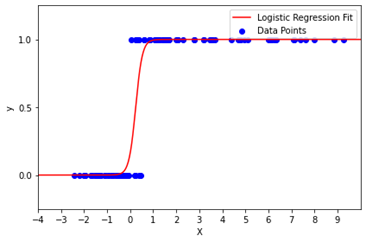
Logistic regression is used to solve binary classification problems where there are two class values. A Logistic Regression can be referred to as a Linear Regression model but the former uses a complex cost function which is called the ‘Sigmoid function’ or ‘logistic function’ instead of a linear function. The sigmoid function plots any real value into an alternate value in the range 0 to 1. In machine learning, the sigmoid (the S-shaped curve) is employed to map projections to probabilities.
Using logistic regression, you can make simple predictions to forecast the probability that an observation belongs to one of two possible classes. An example would be to look at historical records of a bank customer to understand whether he may or may not default on his loan repayments.
Multi-class classification is also supported with logistic regression by using one v/s rest scheme. In the one v/s all method, while working with one class at a time, that class is denoted by 1 and the remaining by 0 and their results are combined to get the final fit.
As shown in the figure above, the logistic regression model classifies all points below the sigmoid curve in one category and above the curve to another
Decision-tree
The Decision-tree model falls under the supervised learning category. But unlike other supervised learning algorithms, this particular algorithm can even be used for solving regression and classification problems. It is largely used to help decide about any process.
This model is basically a rule-based approach where a tree-like structure is created. Learning starts from the top of the tree (i.e. the root node). Each node basically consists of a question, to which the answer is positive or negative. The questions at different levels are related to the different attributes in the dataset. Based on the answers at different levels of the tree, the algorithm concludes as to what should be the output corresponding to the input sample.
It is a very popular algorithm, mainly due to its simplicity. The benefit of this algorithm is that for some input samples, it can predict the output quickly, without even traversing a major portion of the tree. But that depends entirely on the dataset.
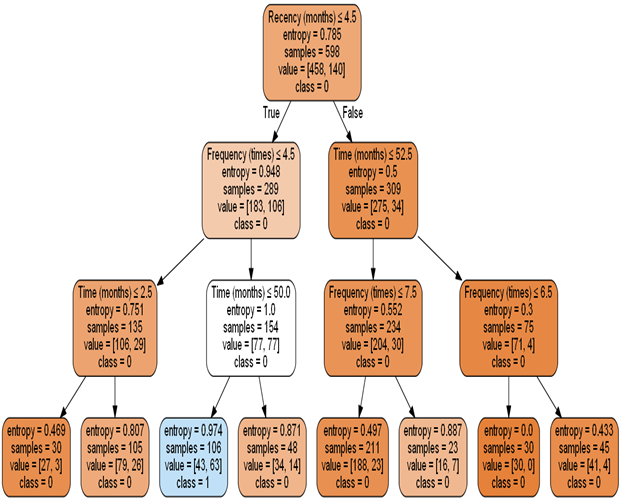
The above diagram represents a decision tree that predicts whether a patient has donated blood based on Recency, Frequency Monetary, and Time. The dataset can be found here.
Depending on the kind of target variables, Decision-trees come in two types:
Categorical Variable Decision Tree
In this type of Decision Tree, the output is the category (or class) to which the test sample belongs. This type of tree is called the Classification Tree. Ex: Deciding whether a customer will turn out to be a loan-defaulter.
Continuous Variable Decision Tree
In this type of Decision Tree, the output is a real number corresponding to a test sample. This type of tree is called a Regression Tree. An example of this would be to try and understand whether to invest in a certain company’s shares or not. What is also required for that is all possible variables.
Some techniques, often called ensemble methods, construct more than one decision tree. Ensemble learning involves combining the decisions of multiple weak learners (or models) to produce one strong learner. In most cases, a single Decision Tree alone is not sufficient to provide good accuracy. So general practice is to use multiple Decision Trees to come up with one strong algorithm.
What is Machine Learning Used for In Data Analytics
In one line, to analyze big data in a speedier and more in-depth manner. Here are some of its uses:
Deciphering patterns: Machine learning data analytics can help decode trends in certain businesses or sectors. It can help identify diseases in the initial stage among patients, for example. Or unearth the buying patterns of consumers in a certain geography. Machine learning can help interpret consumer patterns and behaviors accurately. Media and the entertainment industry use machine learning data analytics to understand the likes and dislikes of their audiences and to send out targeted content.
Understanding customer behavior and segmentation: User modeling is big with machine learning data analytics. Businesses can use it to explore customer behavior. It can mine data to capture the mind of the client to make intelligent decisions.
Customer segmentation can help you in many ways: It helps a business develop focused strategies to hold on to its top-paying customers. Or, to re-engage those clients who haven’t purchased in a while. It is also used to provide a heightened customer experience.
Help in decision-making: Using time-series analysis, machine learning in data analytics can aid an enterprise’s decision-making framework by aggregating and analyzing data. Machine learning-based modeling techniques can give reliable insight into a consumer’s persona to help predict behavior. It can help businesses make insightful marketing decisions.
Who is Using Machine Learning in Data Analytics?
Needless to say, almost every field or industry that relies on data is using or can use data analytics, and consequentially, deploy machine learning. From financial institutions to governments, from the medical world to retail, including e-commerce, you can find machine learning being deployed there.
Healthcare: Machine learning can be used in the diagnosis of diseases, medical research, and therapy planning. It can be utilized in the prognosis of cancer, for example. It can be used to analyze data from wearable devices and sensors, and to flag likely hurdles to arise while a patient is being medically treated.
Financial Institutions: Machine learning-based models can be a great asset for financial institutions such as stock markets, banks, and credit card businesses. Today it’s used for two main reasons: to get insights from financial data, and to prevent financial fraud. Machine learning can help FIs to track customer spending patterns, or to perform stock or currency market analysis.
Retail: This is where machine learning was deployed at the earliest. E-commerce Sites, for example, use machine learning in data analytics to recommend items you might like based on your previous purchase history. It is machine learning again that helps analyze the copious amounts of customer-related data, including likes and dislikes, previous purchases, and so on, to help personalize the shopping experience, or to implement a marketing campaign.
Machine learning can also be used to increase customer engagement while they are browsing through online catalogs to increase engagement and impact conversion rates.
Then, of course, there are recommender systems that are used to increase sales by offering highly personalized offers. These also help speed up searches to make it easy for customers to access the content they are interested in.
Challenges and Opportunities in Machine Learning
Here are a few challenges and opportunities in machine learning. The biggest entry to the barrier for machine learning-based data analytics is the mindset of enterprises. If eventually, your business does decide to go ahead with machine learning data analytics, what is required first and foremost is a change in management fundamentals.
While its potential gains do hold appeal, companies that plan to invest in such machine learning-based advanced analytics solutions must ask themselves this one basic question: do we really need it?
Many organizations can benefit by using traditional data analytics without the use of complicated ML applications. In many cases, traditional data analysis is enough to do the job. You can generate reports of what’s happened in the past, or of what’s happening today.
If your business really has vast repositories of big data, and making sense of it is all beyond the scope of your team of human analysts, then deploying machine learning in analytics is better.
Machine learning is a data analytics technique that teaches computers to do what comes naturally to humans and animals: learn from experience. Machine learning algorithms use computational methods to directly “learn” from data without relying on a predetermined equation as a model.
As the number of samples available for learning increases, the algorithm adapts to improve performance. Deep learning is a special form of machine learning.
How does machine learning work?
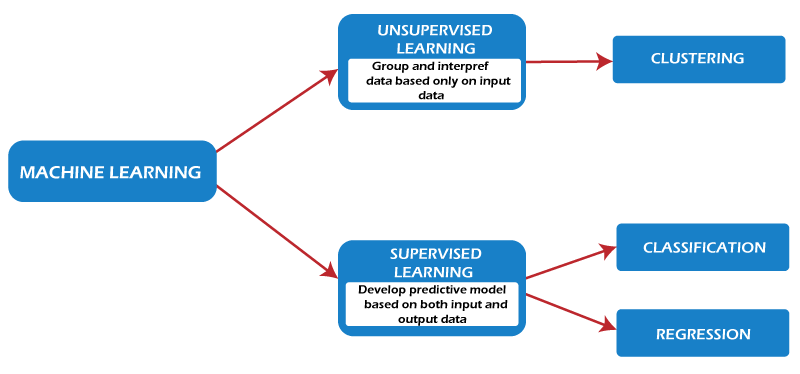
Machine learning uses two techniques: supervised learning, which trains a model on known input and output data to predict future outputs, and unsupervised learning, which uses hidden patterns or internal structures in the input data.
Supervised learning
Supervised machine learning creates a model that makes predictions based on evidence in the presence of uncertainty. A supervised learning algorithm takes a known set of input data and known responses to the data (output) and trains a model to generate reasonable predictions for the response to the new data. Use supervised learning if you have known data for the output you are trying to estimate.
Supervised learning uses classification and regression techniques to develop machine learning models.
Classification models classify the input data. Classification techniques predict discrete responses. For example, the email is genuine, or spam, or the tumor is cancerous or benign. Typical applications include medical imaging, speech recognition, and credit scoring.
Use taxonomy if your data can be tagged, classified, or divided into specific groups or classes. For example, applications for handwriting recognition use classification to recognize letters and numbers. In image processing and computer vision, unsupervised pattern recognition techniques are used for object detection and image segmentation.
Common algorithms for performing classification include support vector machines (SVMs), boosted and bagged decision trees, k-nearest neighbors, Naive Bayes, discriminant analysis, logistic regression, and neural networks.
Regression techniques predict continuous responses – for example, changes in temperature or fluctuations in electricity demand. Typical applications include power load forecasting and algorithmic trading.
If you are working with a data range or if the nature of your response is a real number, such as temperature or the time until a piece of equipment fails, use regression techniques.
Common regression algorithms include linear, nonlinear models, regularization, stepwise regression, boosted and bagged decision trees, neural networks, and adaptive neuro-fuzzy learning.
Using supervised learning to predict heart attacks
Physicians want to predict whether someone will have a heart attack within a year. They have data on previous patients, including age, weight, height, and blood pressure. They know if previous patients had had a heart attack within a year. So the problem is to combine existing data into a model that can predict whether a new person will have a heart attack within a year.
Unsupervised Learning
Detects hidden patterns or internal structures in unsupervised learning data. It is used to eliminate datasets containing input data without labeled responses.
Clustering is a common unsupervised learning technique. It is used for exploratory data analysis to find hidden patterns and clusters in the data. Applications for cluster analysis include gene sequence analysis, market research, and commodity identification.
For example, if a cell phone company wants to optimize the locations where they build towers, they can use machine learning to predict how many people their towers are based on.
A phone can only talk to 1 tower at a time, so the team uses clustering algorithms to design the good placement of cell towers to optimize signal reception for their groups or groups of customers.
Common algorithms for performing clustering are k-means and k-medoids, hierarchical clustering, Gaussian mixture models, hidden Markov models, self-organizing maps, fuzzy C-means clustering, and subtractive clustering.
Ten methods are described and it is a foundation you can build on to improve your machine learning knowledge and skills:
Regression
Classification
Clustering
Dimensionality Reduction
Ensemble Methods
Neural Nets and Deep Learning
Transfer Learning
Reinforcement Learning
Natural Language Processing
Word Embedding’s
Let’s differentiate between two general categories of machine learning: supervised and unsupervised. We apply supervisedML techniques when we have a piece of data that we want to predict or interpret. We use the previous and output data to predict the output based on the new input.
For example, you can use supervised ML techniques to help a service business that wants to estimate the number of new users that will sign up for the service in the next month. In contrast, untrained ML looks at ways of connecting and grouping data points without using target variables to make predictions.
In other words, it evaluates data in terms of traits and uses traits to group objects that are similar to each other. For example, you can use unsupervised learning techniques to help a retailer who wants to segment products with similar characteristics-without specifying in advance which features to use.
1. Regression
Regression methods fall under the category of supervised ML. They help predict or interpret a particular numerical value based on prior data, such as predicting an asset’s price based on past pricing data for similar properties.
The simplest method is linear regression, where we use the mathematical equation of the line (y = m * x + b) to model the data set. We train a linear regression model with multiple data pairs (x, y) by computing the position and slope of a line that minimizes the total distance between all data points and the line. In other words, we calculate the slope (M) and the y-intercept (B) for a line that best approximates the observations in the data.
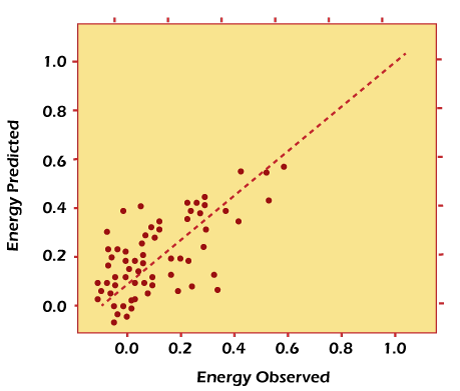
Let us consider a more concrete example of linear regression. I once used linear regression to predict the energy consumption (in kW) of some buildings by gathering together the age of the building, the number of stories, square feet, and the number of wall devices plugged in.
Since there was more than one input (age, square feet, etc.), I used a multivariable linear regression. The principle was similar to a one-to-one linear regression. Still, in this case, the “line” I created occurred in a multi-dimensional space depending on the number of variables.
Now imagine that you have access to the characteristics of a building (age, square feet, etc.), but you do not know the energy consumption. In this case, we can use the fitted line to estimate the energy consumption of the particular building. The plot below shows how well the linear regression model fits the actual energy consumption of the building.
Note that you can also use linear regression to estimate the weight of each factor that contributes to the final prediction of energy consumed. For example, once you have a formula, you can determine whether age, size, or height are most important.
Linear regression model estimates of building energy consumption (kWh).
Regression techniques run the gamut from simple (linear regression) to complex (regular linear regression, polynomial regression, decision trees, random forest regression, and neural nets). But don’t get confused: start by studying simple linear regression, master the techniques, and move on.
2. Classification
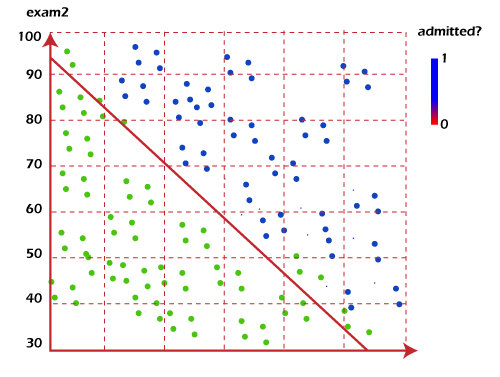
In another class of supervised ML, classification methods predict or explain a class value. For example, they can help predict whether an online customer will purchase a product. Output can be yes or no: buyer or no buyer. But the methods of classification are not limited to two classes. For example, a classification method can help assess whether a given image contains a car or a truck. The simplest classification algorithm is logistic regression, which sounds like a regression method, but it is not. Logistic regression estimates the probability of occurrence of an event based on one or more inputs.
For example, logistic regression can take two test scores for a student to predict that the student will get admission to a particular college. Because the guess is a probability, the output is a number between 0 and 1, where 1 represents absolute certainty. For the student, if the predicted probability is greater than 0.5, we estimate that they will be admitted. If the predicted probability is less than 0.5, we estimate it will be rejected.
The chart below shows the marks of past students and whether they were admitted. Logistic regression allows us to draw a line that represents the decision boundary.
Because logistic regression is the simplest classification model, it is a good place to start for classification. As you progress, you can dive into nonlinear classifiers such as decision trees, random forests, support vector machines, and neural nets, among others.
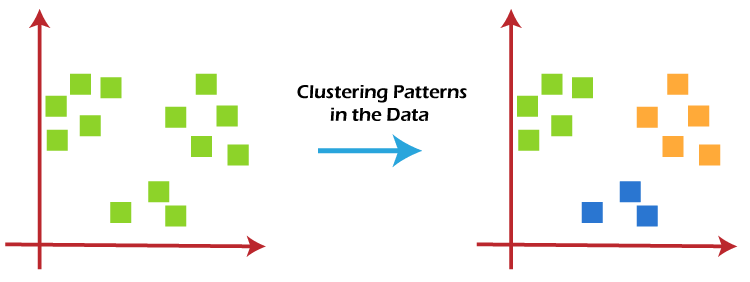
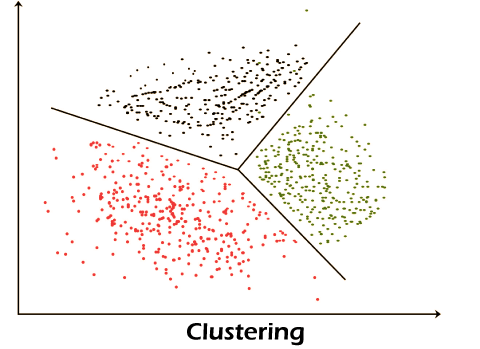
3. Clustering
We fall into untrained ML with clustering methods because they aim to group or group observations with similar characteristics. Clustering methods do not use the output information for training but instead let the algorithm define the output. In clustering methods, we can only use visualization to observe the quality of the solution.
The most popular clustering method is K-Means, where “K” represents the number of clusters selected by the user. (Note that there are several techniques for selecting the value of K, such as the elbow method.)
Randomly chooses K centers within the data.
Assigns each data point closest to the randomly generated centers.
Otherwise, we return to step 2. (To prevent ending in an infinite loop if the centers continue to change, set the maximum number of iterations in advance.)
The process is over if the centers do not change (or change very little).
The next plot applies the K-means to the building’s data set. The four measurements pertain to air conditioning, plug-in appliances (microwave, refrigerator, etc.), household gas, and heating gas. Each column of the plot represents the efficiency of each building.
Linear regression model estimates of building energy consumption (kWh).
Regression techniques run the gamut from simple (linear) to complex (regular linear, polynomial, decision trees, random forest, and neural nets). But don’t get confused: start by studying simple linear regression, master the techniques, and move on.
Clustering Buildings into Efficient (Green) and Inefficient (Red) Groups.
As you explore clustering, you will come across very useful algorithms such as Density-based Spatial Clustering of Noise (DBSCAN), Mean Shift Clustering, Agglomerative Hierarchical Clustering, and Expectation-Maximization Clustering using the Gaussian Mixture Model, among others.
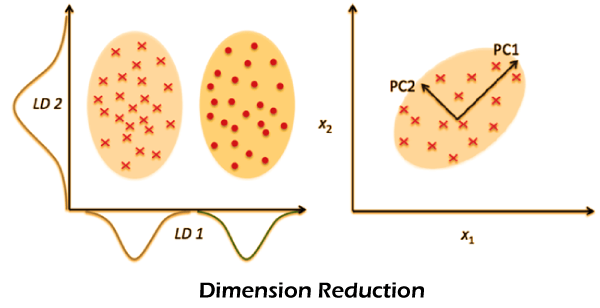
4. Dimensionality Reduction
We use dimensionality reduction to remove the least important information (sometimes unnecessary columns) from the data setFor example, and images may consist of thousands of pixels, which are unimportant to your analysis. Or, when testing microchips within the manufacturing process, you may have thousands of measurements and tests applied to each chip, many of which provide redundant information. In these cases, you need a dimensionality reduction algorithm to make the data set manageable.
The most popular dimensionality reduction method is Principal Component Analysis (PCA), which reduces the dimensionality of the feature space by finding new vectors that maximize the linear variance of the data. (You can also measure the extent of information loss and adjust accordingly.) When the linear correlations of the data are strong, PCA can dramatically reduce the dimension of the data without losing too much information.
Another popular method is t-stochastic neighbor embedding (t-SNE), which minimizes nonlinear dimensions. People usually use t-SNE for data visualization, but you can also use it for machine learning tasks such as feature space reduction and clustering, to mention a few.
The next plot shows the analysis of the MNIST database of handwritten digits. MNIST contains thousands of images of numbers 0 to 9, which the researchers use to test their clustering and classification algorithms. Each row of the data set is a vector version of the original image (size 28 x 28 = 784) and a label for each image (zero, one, two, three, …, nine). Therefore, we are reducing the dimensionality from 784 (pixels) to 2 (the dimensions in our visualization). Projecting to two dimensions allows us to visualize higher-dimensional original data sets.
5. Ensemble Methods
Imagine that you have decided to build a bicycle because you are not happy with the options available in stores and online. Once you’ve assembled these great parts, the resulting bike will outlast all other options.
Each model uses the same idea of combining multiple predictive models (supervised ML) to obtain higher quality predictions than the model.
For example, the Random Forest algorithm is an ensemble method that combines multiple decision trees trained with different samples from a data set. As a result, the quality of predictions of a random forest exceeds the quality of predictions predicted with a single decision tree.
Think about ways to reduce the variance and bias of a single machine learning model. By combining the two models, the quality of the predictions becomes balanced. With another model, the relative accuracy may be reversed. It is important because any given model may be accurate under some conditions but may be inaccurate under other conditions.
Most of the top winners of Kaggle competitions use some dressing method. The most popular ensemble algorithms are Random Forest, XGBoost, and LightGBM.
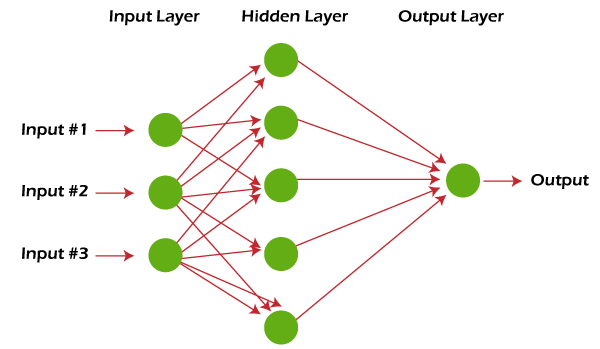
6. Neural networks and deep learning
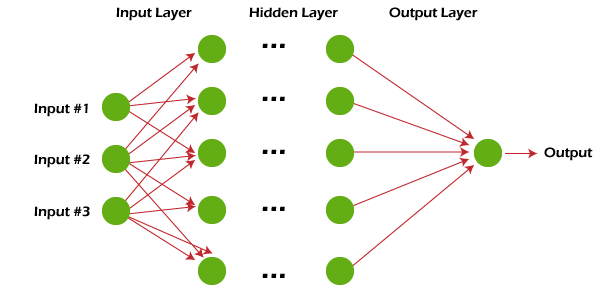
Unlike linear and logistic regression, which is considered linear models, neural networks aim to capture nonlinear patterns in data by adding layers of parameters to the model. The simple neural net has three inputs as in the image below, a hidden layer with five parameters and an output layer.
Neural network with a hidden layer.
The neural network structure is flexible enough to construct our famous linear and logistic regression. The term deep learning comes from a neural net with many hidden layers and encompasses a variety of architectures.
It is especially difficult to keep up with development in deep learning as the research and industry communities redouble their deep learning efforts, spawning whole new methods every day.
Deep learning: A neural network with multiple hidden layers.
Deep learning techniques require a lot of data and computation power for best performance as this method is self-tuning many parameters within vast architectures. It quickly becomes clear why deep learning practitioners need powerful computers with GPUs (Graphical Processing Units).
In particular, deep learning techniques have been extremely successful in vision (image classification), text, audio, and video. The most common software packages for deep learning are Tensorflow and PyTorch.
7. Transfer learning
Let’s say you are a data scientist working in the retail industry. You’ve spent months training a high-quality model to classify images as shirts, t-shirts, and polos. Your new task is to create a similar model to classify clothing images like jeans, cargo, casual, and dress pants.
Transfer learning refers to reusing part of an already trained neural net and adapting it to a new but similar task. Specifically, once you train a neural net using the data for a task, you can move a fraction of the trained layers and combine them with some new layers that you can use for the new task. The new neural net can learn and adapt quickly to a new task by adding a few layers.
The advantage of transfer learning is that you need fewer data to train a neural net, which is especially important because training for deep learning algorithms is expensive in terms of both time and money.
The main advantage of transfer learning is that you need fewer data to train a neural net, which is especially important because training for deep learning algorithms is expensive both in terms of time and money (computational resources). Of course, it isn’t easy to find enough labeled data for training.
Let’s come back to your example and assume that you use a neural net with 20 hidden layers for the shirt model. After running a few experiments, you realize that you can move the 18 layers of the shirt model and combine them with a new layer of parameters to train on the pant images.
So the Pants model will have 19 hidden layers. The inputs and outputs of the two functions are different but reusable layers can summarize information relevant to both, for example, fabric aspects.
Transfer learning has become more and more popular, and there are many concrete pre-trained models now available for common deep learning tasks such as image and text classification.
8. Reinforcement Learning
Imagine a mouse in a maze trying to find hidden pieces of cheese. At first, the Mouse may move randomly, but after a while, the Mouse’s feel helps sense which actions bring it closer to the cheese. The more times we expose the Mouse to the maze, the better at finding the cheese.
Process for Mouse refers to what we do with Reinforcement Learning (RL) to train a system or game. Generally speaking, RL is a method of machine learning that helps an agent to learn from experience.
RL can maximize a cumulative reward by recording actions and using a trial-and-error approach in a set environment. In our example, the Mouse is the agent, and the maze is the environment. The set of possible actions for the Mouse is: move forward, backward, left, or right. The reward is cheese.
You can use RL when you have little or no historical data about a problem, as it does not require prior information (unlike traditional machine learning methods). In the RL framework, you learn from the data as you go. Not surprisingly, RL is particularly successful with games, especially games of “correct information” such as chess and Go. With games, feedback from the agent and the environment comes quickly, allowing the model to learn faster. The downside of RL is that it can take a very long time to train if the problem is complex.
As IBM’s Deep Blue beat the best human chess player in 1997, the RL-based algorithm AlphaGo beat the best Go player in 2016. The current forerunners of RL are the teams of DeepMind in the UK.
In April 2019, the OpenAI Five team was the first AI to defeat the world champion team of e-sport Dota 2, a very complex video game that the OpenAI Five team chose because there were no RL algorithms capable of winning it. You can tell that reinforcement learning is a particularly powerful form of AI, and we certainly want to see more progress from these teams. Still, it’s also worth remembering the limitations of the method.
9. Natural Language Processing
A large percentage of the world’s data and knowledge is in some form of human language. For example, we can train our phones to autocomplete our text messages or correct misspelled words. We can also teach a machine to have a simple conversation with a human.
Natural Language Processing (NLP) is not a machine learning method but a widely used technique for preparing text for machine learning. Think of many text documents in different formats (Word, online blog). Most of these text documents will be full of typos, missing characters, and other words that need to be filtered out. At the moment, the most popular package for processing text is NLTK (Natural Language Toolkit), created by Stanford researchers.
The easiest way to map text to a numerical representation is to count the frequency of each word in each text document. Think of a matrix of integers where each row represents a text document, and each column represents a word. This matrix representation of the term frequency is usually called the term frequency matrix (TFM). We can create a more popular matrix representation of a text document by dividing each entry on the matrix by the weighting of how important each word is in the entire corpus of documents. We call this method Term Frequency Inverse Document Frequency (TFIDF), and it generally works better for machine learning tasks.
10. Word Embedding
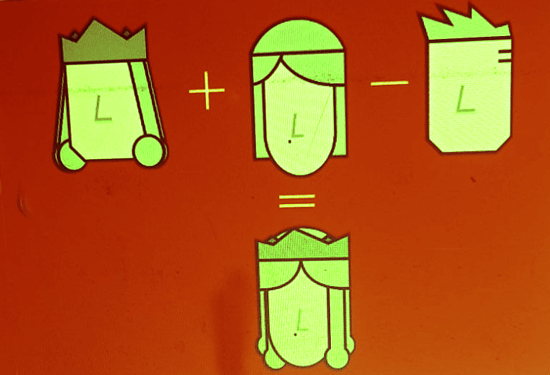
TFM and TFIDF are numerical representations of text documents that consider only frequency and weighted frequencies to represent text documents. In contrast, word embedding can capture the context of a word in a document. As with word context, embeddings can measure similarity between words, allowing us to perform arithmetic with words.
Word2Vec is a neural net-based method that maps words in a corpus to a numerical vector. We can then use these vectors to find synonyms, perform arithmetic operations with words, or represent text documents (by taking the mean of all word vectors in the document). For example, we use a sufficiently large corpus of text documents to estimate word embeddings.
Let’s say vector(‘word’) is the numeric vector representing the word ‘word’. To approximate the vector (‘female’), we can perform an arithmetic operation with the vectors:
The word representation allows finding the similarity between words by computing the cosine similarity between the vector representations of two words. The cosine similarity measures the angle between two vectors.
We calculate word embedding’s using machine learning methods, but this is often a pre-stage of implementing machine learning algorithms on top. For example, let’s say we have access to the tweets of several thousand Twitter users. Let’s also assume that we know which Twitter users bought the house. To estimate the probability of a new Twitter user buying a home, we can combine Word2Vec with logistic regression.
You can train the word embedding yourself or get a pre-trained (transfer learning) set of word vectors. To download pre-trained word vectors in 157 different languages, look at Fast Text.
Summary
Studying these methods thoroughly and fully understanding the basics of each can serve as a solid starting point for further study of more advanced algorithms and methods.
There is no best way or one size fits all. Finding the right algorithm is partly just trial and error – even highly experienced data scientists can’t tell whether an algorithm will work without trying it out. But algorithmic selection also depends on the size and type of data you’re working with, the insights you want to derive from the data, and how those insights will be used.