Abstract
- Leaf size varies within and between species, and previous work has linked this variation to the environment and evolutionary history separately. However, many previous studies fail to interlink both factors and are often data limited.
- To address this, our study developed a new workflow using machine learning to automate the extraction of leaf traits (leaf area, largest in circle area and leaf curvature) from herbarium collections of Australian eucalypts (Eucalyptus, Angophora and Corymbia). Our dataset included 136,599 measurements, expanding existing data on this taxon’s leaf area by roughly 50 fold.
- With this dataset, we were able to confirm global positive relationships between leaf area and mean annual temperature and precipitation. Furthermore, we linked this trait climate relationship to phylogeny, revealing large variation at the within species level, potentially due to gene flow suppressing local adaptation. At deeper phylogenetic levels, the relationship strengthens and the slope converges towards the overall eucalypt slope, suggesting that the effect of gene flow relaxes just above the species level.
- The strengthening of trait-climate correlations just beyond the intraspecific level may represent a widespread phenomenon across various traits and taxa. Future studies may unveil these relationships with the larger sample sizes of new trait datasets generated through machine learning.
Introduction
As a fundamental unit of photosynthesis, leaf area has impacts across a variety of processes. This has led to an extensive body of research, ranging from regulating carbon flux over vast areas of the earth (Reich 2012), to influencing ecosystem dynamics by affecting the plant’s individual growth and survival (Wang et al. 2019, Wright et al. 2017, Leigh et al. 2017). Therefore, an improved understanding of leaf area variation can facilitate better predictions for plant adaptation to changing climates (Wang et al. 2022, Pritzkowet al.2020). This, in turn, will enable better comprehension of leaf energy balances (Wright et al. 2017) and their relationship with models of forest productivity and plantation growth (Madani et al. 2018,Reich 2012, Battaglia et al.1998).
The distribution of a plant’s traits may be tied to their environment (Li et al. 2020, Souza et al. 2018, Wright et al. 2017, Moles et al. 2014), and this link may manifest in different forms. One potential form of a trait-climate relationship is when variation is constrained by one or more limits that shift with climate. In this case, two limits may form a tight relationship (e.g.,Reich 2003), and one limit forms a ‘constraint triangle’that contains a probabilistic distribution of traits across the landscape (e.g., Wright et al. 2017, Guo et al. 2000, Cornelissen 1999). For leaf area, mean annual precipitation and temperature are two key environmental drivers that affect this triangle. However, current research suggests that there is a significant constraint on maximum leaf area that shifts with climate, whereas there is no corresponding constraint on minimum leaf area (Wright et al. 2017).
Across climatic gradients, leaf area has been found to increase from dry to wet environments and from colder to hotter climates (Souza et al. 2018, Wright et al. 2017, Moles et al. 2014,Peppe et al. 2011). One proposed explanation is that smaller leaves, particularly leaves with narrow effective widths, possess more effective thermal regulation and reduced water loss through a smaller boundary layer. This layer is a thin space around the leaf with reduced air movement, promoting cooling (Leigh et al. 2017, Nobel 2009). However, the relationship between leaf area and climate is complex. For instance, studies have shown thermal constraints on leaf area to be ineffective in ever wet conditions (Souza et al. 2018 Wright etal. 2017). Therefore, while a general relationship exists between leaf area and climate, it is influenced by various factors.
Empirical research at differing geographical and taxonomic scales have yielded varied results on the relative importance of temperature and precipitation in influencing leaf traits; with regional trait-climate correlations possibly being decoupled at local scales (Ackerly et al.2007). For instance, in Australian eucalypt vegetation stands, Ellis & Hatton (2008) found water availability to play a greater part than temperature in explaining leaf area index. On the other hand, in central Europe ,Meier & Leuschner (2008) found leaf expansion of Fagus sylvatica(L.)stands primarily controlled by temperature, consistent with a global meta analysis (Moles et al. 2014). Similarly, leaf area index in Melaleuca lanceolata (Otto) in southern Australia was found to have a stronger association to mean maximum temperature than precipitation (Hill et al. 2014). Here, our study aims to clarify this relationship between both climatic variables and leaf traits of Australian eucalypts through a unique workflow. In turn, this can contribute to a better local understanding of ecological processes and improved predictions of trait composition (Peppe et al. 2011, Violle et al. 2007).
When studying the variation in leaf area across climate, it is important to also consider the influence of evolutionary history (e.g., Milla & Reich 2007,McDonald et al. 2003, Ackerly etal. 2002). Varying effects of phylogeny, and contemporary demography (intraspecific gene flow) may result in trait-climate relationships within species being weaker, unrelated, or even following opposite directions to that reported among species (with various potential scenarios illustrated in Fig. 1) (Wilde et al. 2023, An et al. 2021, McDonald et al. 2003, Ackerly et al.2002). For instance, in Figure Scenario 2, gene flow between populations may prevent adaptation to local environments, counteracting environmental pressures (reviewed at Alexander et al. 2022, Leimu & Fischer 2008). Additionally, an individual’s evolutionary history may constrain phenotype and local adaptive capacity (Fig. 1 Scenario 3, An et al. 2021, Leimu & Fischer 2008). This intraspecific trait variation (ITV) has been debated in previous studies. Some have suggested that ITV may obscure general trends (Bastias et al.2017, Ackerly et al. 2002), while others argue that it does not have such an impact (Westerband et al. 2021, Li et al. 2020, Mudráket al. 2019). This conflict is potentially due to the limitations of datasets generated using traditional methods (also suggested by Li et al.
2020, Bastias et al. 2017). Regardless, studies of links of leaf traits and climatic variables across varying evolutionary scales, from ITV (e.g., An et al. 2021) to major plant families (e.g.,Wilde et al. 2023, Ackerly & Reich 1999) is critical to predicting phenotypic evolution and shifts in traits under a changing climate.
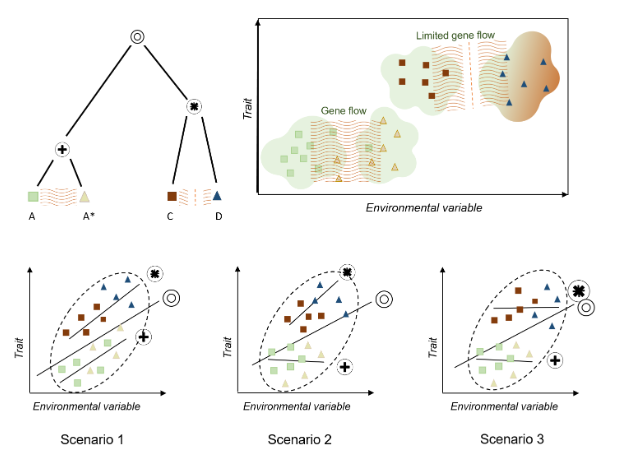
Figure 1. Three scenarios illustrating impacts of evolutionary divergence and intraspecific gene flow on trait-climate relationships. Groups A and A* are populations of a species and remain connected by gene flow, while groups C and D are quite recently ,but completely ,diverged and have limited recent gene flow. The circles represent different internal nodes within the hypothetical phylogenetic tree. In all three scenarios, there is a positive overall trait-climate association. In Scenario 1, there is a strong trait-climate relationship within each of the two recently diverged clades, resulting in roughly similar slopes in each clade In Scenario 2, gene flow strongly suppresses local adaptation within species, potentially causing divergence from overall trait-climate trends. This effect is however relaxed in recently diverged groups. Therefore, the clade consisting of A and A* does not exhibit a trait-climate relationship, and the clade containing groups C and D exhibits a strong trait-climate relationship. In Scenario 3, trait evolution is more constrained, so that strong adaptation is observed only among longer diverged groups. Here, there is no trait-climate relationships within the clade containing A and A* or C and D, but there is an association overall, reflecting adaptation over longer time scales.
Understanding evolution of leaf morphology has a recognised importance (Mudrák et al.2019,Souza et al. 2018, Leimu et al. 2008).Despite this, there is a paucity of research that examines leaf variation in the perspective of phylogeny and ITV simultaneously. One potential reason lies in the laborious and time intensive nature of data collection (Li et al.2020, Bastias et al. 2017) ,which traditionally involve manual measurements of each data point. This makes it difficult to gather datasets with high intraspecific sampling within and across different clades and climates (Li et al. 2020,Bastias et al. 2017).As a consequence, few studies spanning both intraspecific and phylogenetic scales simultaneously have been conducted (see also Wilde et al. 2023, Cutts et al. 2021, Goëau et al. 2020, Pearson et al. 2020, Brenskelle et al. 2020).
This study addresses this by using machine learning (ML) paired with herbarium records. Herbarium specimens are pressed plants of various taxa collected globally. These specimens provide a holistic representation of plant shoots and include both mature and juvenile leaves (Kozlov et al. 2021). As a consequence, trait measurements from these sheets will encompass leaves at different developmental stages, propagating into resulting datasets. Herbarium specimens provide extensive phylogenetic and geographic sampling. However, their potential has remained underutilised due to the impracticality of extracting trait data using traditional methods (Heberling 2022). Thus, we employed ML as a new tool to automate the extraction of trait data from these specimens. Previous studies have used ML to extract leaf traits from digital herbarium specimen images (Hussein et al. 2021, Weaver et al. 2020, Younis et al. 2018). However, to our knowledge, this approach is the first to utilise machine learning operationally in trait ecology, allowing us to create a comprehensive dataset that spans various taxonomic levels across Australia. By pairing this dataset with a fully resolved phylogenetic tree (Thornhill et al. 2019), we could link microevolution to macroevolution, enabling a better observation of the shift in trait climate relationships across different clades and evolutionary depths.
Overall, leaf morphological traits enable better comprehension of leaf energy balances (Wright et al. 2017), improving our understanding of ecosystem dynamics (Pritzkow et al.2020) and global vegetation models (Madani et al. 2018, Reich 2012, Battaglia et al.1998).Despite this, there is a paucity of datasets spanning a wide phylogenetic and spatial range (Moran et al. 2016). Our study proposes a method to address this gap by using ML to bypass traditional trait collection methods. In particular, we sought to address the following questions:
a) Could ML be used to automatically extract various commonly measured leaf morphological traits, including leaf area, and the largest in circle area? This will allow us to build a large dataset, unique in its ability in allowing us to answer the following questions simultaneously in the study taxa.
b) How do leaf traits shift across the Australian climate? We hypothesise that leaf area and largest in circle area will correlate positively with mean annual precipitation and temperature
c) To what extent does phylogeny shape leaf traits?We hypothesise that gene flow will resolve in large trait variability at a shallow phylogenetic level (within species), which will gradually resolve to a trait-climate relationship at deeper levels (for example, among species).
Our study and its findings help reveal the relationship between traits and their influences, in addition to formulating a more efficient method of trait data collection, applicable to additional taxa and traits in the future.
Method
Study clade and design
This study focused on eucalypts, which are the dominant canopy trees throughout many Australian forests and shrublands (Booth et al. 2015, Govindan 2005). The eucalypt clade consists of three genera, Eucalyptus (L’Hér.) ,Angophora (Cav.),and Corymbia (K.D. Hill & L.A.S. Johnson). They were selected as the study genera for their wide distribution across Australia’s temperature and precipitation range (Fig. 2), the availability of a molecular phylogeny for the clade (Thornhill et al. 2019), and characteristic simple leaves with entire margins. These features allowed us to explore the impact of climate and phylogeny as drivers of leaf trait variation at different evolutionary scales, with the aid of machine learning (ML).
Digital images of herbarium sheets from the National Herbarium of New South Walespds.s3ap southeast 2.amazonaws.com/images/)were used to capture trait variation across wide spatial and environmental ranges (Fig. 2) This enabled the study of traits in a broader range of lineages and biomes than data collected using observational approaches (Heberling 2022). Herbarium specimens are collected with the aim to record traits present in the population (Kozlov et al. 2021) and thus include both mature and immature leaves. As such, our workflow uses a novel approach of trait sampling that diverges from conventional sampling methods of physiologists, which target fully expanded leaves (e.g., in Wright et al. 2017 and Pérez Harguindeguy et al. 2013). This distinction is critical within eucalypts due to the significance of ontogeny in leaf morphology, and it is worth noting the important implications it plays in the analysis.
Our project aimed to generate a large dataset of leaf measurements from digital images of eucalypt herbarium specimens and use it to test ecological associations. This dataset would be unusual in its combination of wide spatial distribution (Fig2 a) and its deep intra-and interspecific sampling. To do this, the method consisted of three separate parts. (i) Develop and refine a leaf masking model, (ii) develop and refine a leaf classification model, (iii)application of models to produce a large trait dataset and carry out quantitative analysis of trait climate relationships in a phylogenetic framework. An overview of this workflow is found at Figure 4, and relevant data and scripts are available in the Supplementary Information.
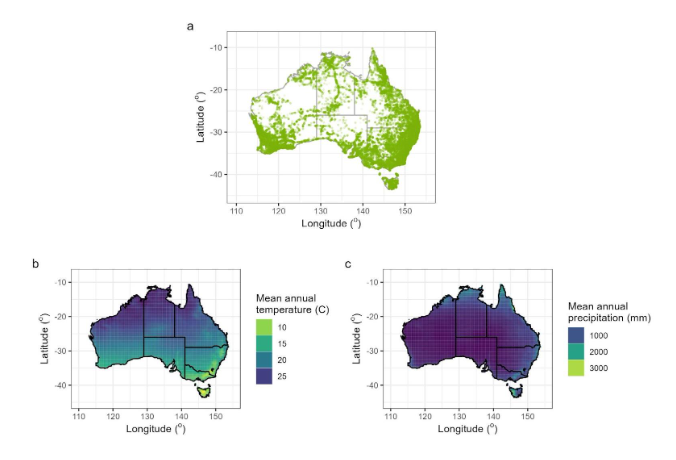
Figure 2. The spatial distribution of sampling. a) The location of each data point of leaf trait measurement. b) The mean annual precipitation across Australia as sourced from WorldClim. c) The mean annual temperature across Australia as sourced from WorldClim, indicating the range of climatic variables the sampling encompasses
Leaf Masking Model
A convolutional neural network (CNN) model was trained to find leaves and pixels that belonged to each ‘instance’ of a leaf (known as instance segmentation). The CNN model used a ResNet50 architecture (He et al. 2015) and was implemented in Detectron2 (Wuet al.2019). Transfer learning was performed to reduce the amount of training required. It was conducted from a pretrained model, a Mask R CNN model with a ResNet50 FPN backbone that was pretrained on the COCO dataset (Lin et al. 2014). Extra details of the model and methods used to train, validate, and test can be found in Supplementary Information A and B. A table of definitions has also been provided in Table 1.
ML models ‘learn’ patterns through a set of training data that has been manually annotated. In this case, our model is ‘learning’ to identify pixels of a leaf using annotated images of herbarium specimens. Generating these manual annotations involved creating a polygon around each instance of a leaf following a protocol provided in Supplementary Information B. All annotations were made using the program LabelMe(v 5.01, Wada 2022). In total, 113 manually annotated herbarium sheets were used to train the model, a further were used for validation during training (for adjustment of hyper parameters by Detectron2) and 20 were used for testing the performance of models after training (for manual adjustment of training parameters).
The final model was refined using an optimisation process. This involved: (i) Training the initial model using the manually annotated training and validation data set, (ii) Predicting leaves for images of the testing data set using the trained model, (iii) Gathering quantitative and qualitative measures of model accuracy from part ii, (iv) altering the model’s training parameters and repeating the cycle at part (i) with a new model. Different iterations of the model are described in Table SA_1.