Introduction to Machine Learning Methods
Machine Learning Methods are used to make the system learn using methods like Supervised learning and Unsupervised Learning which are further classified in methods like Classification, Regression and Clustering. This selection of methods entirely depends on the type of dataset that is available to train the model, as the dataset can be labeled, unlabelled, large. There are various applications (like image classification, Predictive analysis, Spam detection) that uses these different machine learning methods.
How do Machines learn?
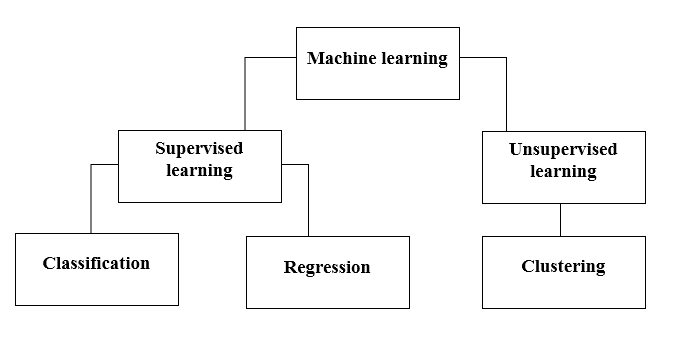
There are various methods to do that. Which method to follow completely depends on the problem statement. Depending on the dataset, and our problem, there are two different ways to go deeper. One is supervised learning and the other is unsupervised learning. The following chart explains the further classification of machine learning methods. We will discuss them one by one.
Take a look at the following chart!
Let’s understand what does Supervised Learning means.
Supervised Learning
As the name suggests, imagine a teacher or a supervisor helping you to learn. The same goes for machines. We train or teach the machine using data that is labeled.
Some of the coolest supervised learning applications are:
- Sentiment analysis (Twitter, Facebook, Netflix, YouTube, etc)
- Natural Language Processing
- Image classification
- Predictive analysis
- Pattern recognition
- Spam detection
- Speech/Sequence processing
Now, supervised learning is further divided into classification and regression. Let’s, understand this.
Classification
Classification is the process of finding a model that helps to separate the data into different categorical classes. In this process, data is categorized under different labels according to some parameters given in input and then the labels are predicted for the data. Categorical means the output variable is a category, i.e red or black, spam or not spam, diabetic or non-diabetic, etc.
Classification models include Support vector machine(SVM),K-nearest neighbor(KNN),Naive Bayes etc.
a) Support vector machine classifier (SVM)
SVM is a supervised learning method that looks at the data and sorts it into one of two categories. I use a hyperplane to categorize the data. A linear discriminative classifier attempts to draw a straight line separating the two sets of data and thereby create a model for classification. It simply tries to find a line or curve (in two dimensions) or a manifold (in multiple dimensions) that divides the classes from each other.
Note: For multiclass classification SVM makes use of ‘one vs rest’, that means calculating different SVM for each class.
b) K-nearest neighbor classifier (KNN)
- If you read carefully, the name itself suggests what the algorithm does. KNN considers the data points which are closer, are much more similar in terms of features and hence more likely to belong to the same class as the neighbor. For any new data point, the distance to all other data points is calculated and the class is decided based on K nearest neighbors. Yes, it may sound lame, but for some of the classification, it works like anything.
- A data point is classified by the maximum number vote of its neighbors, then the data point is assigned to the class nearest among its k-neighbors.
- In KNN, no learning of the model is required and all of the work happens at the time a prediction is requested. That’s why KNN is often referred to as a lazy learning algorithm.
c) Naive Bayes classifier
- Naive Bayes is a machine learning algorithm that is highly recommended for text classification problems. It is based on Bayes’ probability theorem. These classifiers are called naive because they assume that features variables are independent of each other. That means, for example, we have a full sentence for input, then Naive Bayes assumes every word in a sentence is independent of the other ones. And then classify them accordingly. I know, it looks pretty naive, but it’s a great choice for text classification problems and it’s a popular choice for spam email classification.
- It provides different types of Naive Bayes Algorithms like BernoulliNB, GaussianNB, MultinomialNB.
- It considers all the features to be unrelated, so it cannot learn the relationship between features. For example, Let’s say, Varun likes to eat burgers, he also likes to eat French fries with coke. But he doesn’t like to eat a burger and a combination of French fries with coke together. Here, Naive Bayes can not learn the relation between two features but only learns individual feature importance only.
Now let’s move on to the other side of our supervised learning method, which is a regression.
Regression
Regression is the process of finding a model that helps to differentiate the data using continuous values. In this, the nature of the predicted data is ordered. Some of the most widely used regression models include Linear regression, Random forest(Decision trees), Neural networks.
Linear regression
- One of the simplest approaches in supervised learning, which is useful in predicting the quantitative response.
- Linear regression includes finding the best-fitting straight line through the points. The best-fitting line is called a regression line. The best fit line doesn’t exactly pass through all the data points but instead tries it’s best to get close to them.
- It is the widely used algorithm for continuous data. However, it only focuses on the mean of the dependent variable and limits itself to a linear relationship.
- Linear regression can be used for Time series, trend forecasting. It can predict future sales, based on the previous data.
Unsupervised Learning
- Unsupervised learning is based on the approach that can be thought of as the absence of a teacher and therefore of absolute error measures. It’s useful when it’s required to learn clustering or grouping of elements. Elements can be grouped (clustered) according to their similarity.
- In unsupervised learning, data is unlabeled, not categorized and the system’s algorithms act on the data without prior training. Unsupervised learning algorithms can perform more complex tasks than supervised learning algorithms.
- Unsupervised learning includes clustering which can be done by using K means clustering, hierarchical, Gaussian mixture, hidden Markov model.
Unsupervised Learning applications are:
- Similarity detection
- Automatic labeling
- Object segmentation (such as Person, Animal, Films)
Clustering
- Clustering is an unsupervised learning technique that is used for data analytics in many fields. The clustering algorithm comes handy when we want to gain detailed insights about our data.
- A real-world example of clustering would be Netflix’s genre clusters, which are divided for different target customers including interests, demographics, lifestyles, etc. Now you can think about how useful clustering is when companies want to understand their customer base and target new potential customers.
a) K means Clustering
- K means clustering algorithm tries to divide the given unknown data into clusters. It randomly selects ‘k’ clusters centroid, calculates the distance between data points and clusters centroid and then finally assigns the data point to cluster centroid whose distance is minimum of all cluster centroids.
- In k-means, groups are defined by the closest centroid for every group. This centroid acts as ‘Brain’ of the algorithm, they acquire the data points which are closest to them and then add them to the clusters.
b) Hierarchical Clustering
Hierarchical clustering is nearly similar to that of normal clustering unless you want to build a hierarchy of clusters. This can come handy when you want to decide the number of clusters. For example, suppose you are creating groups of different items on the online grocery store. On the front home page, you want a few broad items and once you click on one of the items, specific categories, that is more specific clusters opens up.
Dimensionality reduction
Dimensionality reduction can be considered as compression of a file. It means, taking out the information which is not relevant. It reduces the complexity of data and tries to keep the meaningful data. For example, in image compression, we reduce the dimensionality of the space in which the image stays as it is without destroying too much of the meaningful content in the image.
PCA for Data Visualization
Principal component analysis (PCA) is a dimension reduction method that can be useful to visualize your data. PCA is used to compress higher dimensional data to lower-dimensional data, that is, we can use PCA to reduce a four-dimensional data into three or 2 dimensions so that we can visualize and get a better understanding of the data.