Build a report of actionable insights using modeling and data analysis
Model student behavior using XGBoost and predict struggling/at-risk students
Explore student data and identify what makes a struggling student different than successful students
Help teachers help students – and apply this insight-extracting approach to your other projects and models
Requirements
- Knowledge of Python and the basics of modeling
- Ability to run a Jupyter Notebook and install appropriate Python libraries
Description
Applied data science is about everything that goes before and after your model. Extracting actionable insights is probably the most important aspect of any modeling project! if you want to step up your data science game then this is a great area to study. Let’s do it hands-on, applied a science project together and walk through a student retention model to extract actionable insights and help out struggling students.
- Explore student data
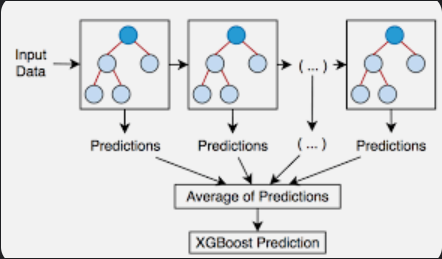
- Model student behavior using XGBoost
- Predict struggling/at-risk students
- Identify what makes a struggling student different than successful students
- Build a report of actionable insights
- And help teachers help students
In the case of a student retention model, looking at the full picture means doing a lot of work before doing any modeling. For example, talking to teachers. We need to better understand the business domain. In this case, finding out what are the problems they face. What are the uncertainties they’d like help with? It is critical to also leverage all their knowledge, like how and when do they determine that a student is at-risk. What data points and triggers do they use to identify someone that could be failing a class and/or their studies. How early can they identify this? Obviously the earlier the better, you don’t want to wait till have too many bad grades and can’t dig themselves out of the hole.
After you’ve distilled all that information in the model, we dig down into the observation level. This is an important point to understand. A model may return feature importance, coefficients, or weights depending on what type of model you use and how it learns. So, imagine a model that predicts heart attacks and finds that older age is the most important feature for the model, and if your patient is young, that’s not going to tell them anything, worse, may lead them to misdiagnose.
Instead, we let the model give us a prediction of the likelihood of something happening, then we dig down to the observation level (i.e. each specific patient or student level) where each case is different and unique and analyze what makes this particular patient/student different from the rest. This may yield some useful information that may allow the professional to better assist – that is actionable insight.
Who this course is for:
- Those interested in stepping up their practical machine learning and analytics knowledge
- Those interested in getting more out of their machine learning projects
Course content