Artificial Intelligence vs Machine Learning vs Deep Learning
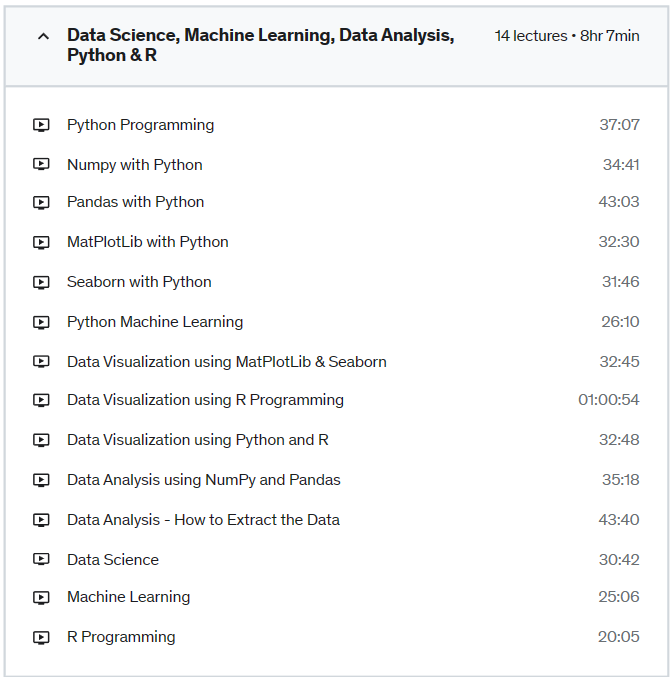
Data Analysis using Python and R
Data Visualization using Python and R
Data Loading using Python and R
Requirements
All graduates, Data analysts and business analysts
Description
Interested in the field of Data Science, Machine Learning, Data Analytics, Data Visualization? Then this course is for you!
This course has been designed by two professional Data Scientists so that we can share our knowledge and help you learn complex theory, algorithms and coding libraries in a simple way.
We will walk you step-by-step into the World of Data Science. With every tutorial you will develop new skills and improve your understanding of this challenging yet lucrative sub-field of Data Science.
Moreover, the course is packed with practical exercises which are based on real-life examples. So not only will you learn the theory, but you will also get some hands-on practice building your own models.
And as a bonus, this course includes both Python and R code templates which you can download and use on your own projects.
Who this course is for:
Beginner Python & R developers curious about Data Science
Learn how to use Prython for coding both R and Python projects
Design complex data science projects in Prython
Requirements
Know some Python and/or R
Basic knowledge about data science and analytics
Description
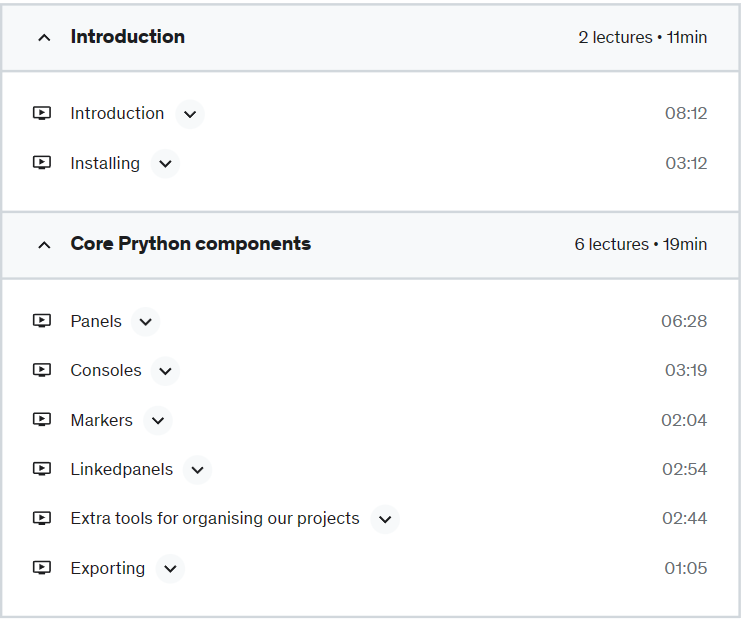
In this course we will learn how to use Prython, which offers a different way of coding than existing R/Python IDEs. It allows us to drop our code into panels that we place and connect in a canvas. In a normal IDE your code will run linearly from start to end, making it really hard to create sub-experiments/tests, and also to organise your project clearly. In Prython each panel accepts multiple IN and OUT connections, effectively transforming it into a 2D Jupiter notebook. It also has a wide array of tools that complement this canvas functionality: such as displaying dataframes next to the panels that modified them, allowing you to freeze your outputs, attaching consoles, navigation markers, etc.
We assume that the student is already familiar with R or Python, and some familiarity with matplotlib, scikit-learn,or keras would be beneficial as well.
Who this course is for:
Python and R practitioners with a focus on data science
ML engineers
Statisticians, engineers, and economists designing statistical models