What is machine learning and how can it be used to improve the industry?
Applications such as search engines, voice assistants, e-commerce sites, “smart” cameras, facial recognition for unlocking the smartphone are now part of our daily lives. Many do not know, however, that these applications make use of artificial intelligence.
Artificial intelligence is used both as a foundation without which the system would not be feasible, and as a support to provide a service as addressed and customized as possible to the user.
This makes us reflect on how artificial intelligence is an already heavily used tool, even if it is currently for the most part confined to the major players in the market.
However, it is expected that in the years to come, AI will become increasingly widespread even on medium-small businesses, with a growing impact on all types of industries and activities.
In fact, we can say that AI will very often become a feature that is already expected to be integrated into products.
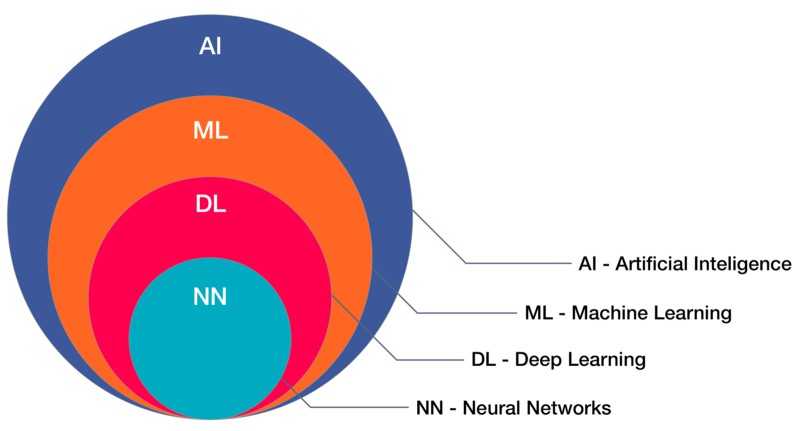
Machine learning is a discipline of artificial intelligence through which many forms of AI can be achieved.
Machine learning collects and uses a multitude of methods such as artificial neural networks, adaptive algorithms, processing images, data mining, and others, to create systems capable of learning autonomously and progressively.
In fact, machine learning can be considered a variant to traditional programming, in which it is predisposed in a machine the ability to learn from data (experience) independently, without being explicitly programmed to do it, to then be able to reuse what has been learned about a certain task.
Types of machine learning
Machine learning is usually divided into three different types, plus others of lesser importance (which are often a hybrid of the three most important).
Each typology differs from the other on the basis of the form of data used for training and on the basis of the task to be performed.
Supervised learning
In this type of machine learning the models are trained starting from labeled data, i.e. data for which the desired output signals are known.
What the model learns are a series of patterns and correlations between the data and the associated label, which it will reuse as a basis for making decisions on future data.
In the case of supervised learning, machine learning problems are divided into two main classes: Regression and Classification.
Regression
An example of a regression problem may be to estimate the cost of a home, described by a series of variables, such as the surface, the number of rooms, etc…
In the training data, for each home, in addition to the descriptive variables, the label (the expected result) is known, which in our case is the price of the house.
In regression, the label is always a continuous variable. What we try to do in these problems is to find, through a more or less complex continuous function, a relationship between descriptive variables and labels.
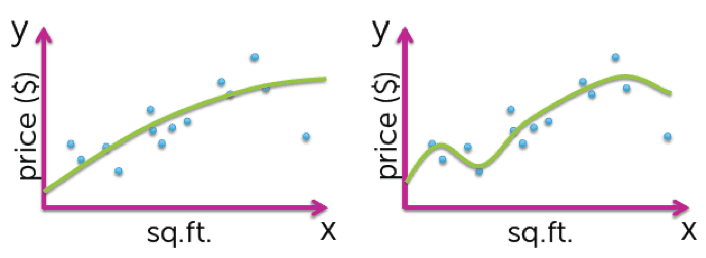
The figure shows, for example, the use of two functions of different complexity, capable of learning a certain trend of the curve, which will then be used to produce estimates on future data.
Classification
In the classification, labels are unordered discrete values that can be considered as belonging to a group of a class.
Using an automatic learning algorithm with supervision, we will be able to separate the two classes (by identifying decision-making boundary) and associate the data, based on their values, to different categories, with a certain confidence value.
Classification can be binary or multiclass.
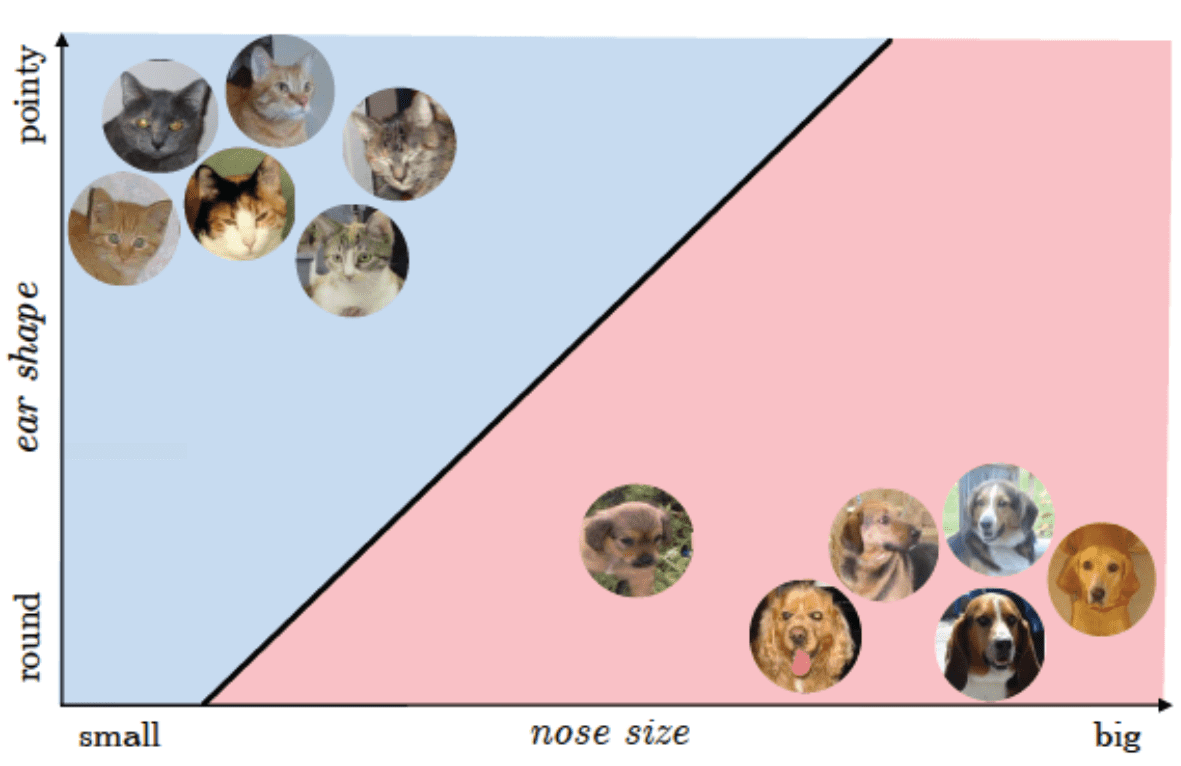
An example of classification could be to determine if, given an image, it is a cat or dog image.
The predictive variables in this case could be the shape of the ears and the size of the nose (features that come extracted through appropriate image processing techniques), while the label simply specifies if it is of a dog or cat.
Unsupervised Learning
In unsupervised learning, unlike supervised learning, we have unlabeled data. In these cases, therefore, we cannot count on a known variable relating to the result.
These techniques try to observe the data structure and to extrapolate from this meaningful information.
Most unsupervised tasks fall into the Clustering problem class.
Clustering
Clustering is an exploratory technique that allows you to aggregate within groups (called clusters) data for which we have no previous knowledge of belonging to groups. We will therefore have large datasets, where the data inside them have similar features to each other.
Within each individual group (or cluster) we will find those data that have many similar characteristics to each other.
Clustering is an excellent technique that allows us to find relationships between data, and to carry out the so-called exploratory data analysis. For example, clustering allows vendors to identify customer clusters based on their profiles to improve marketing activity (market segmentation).
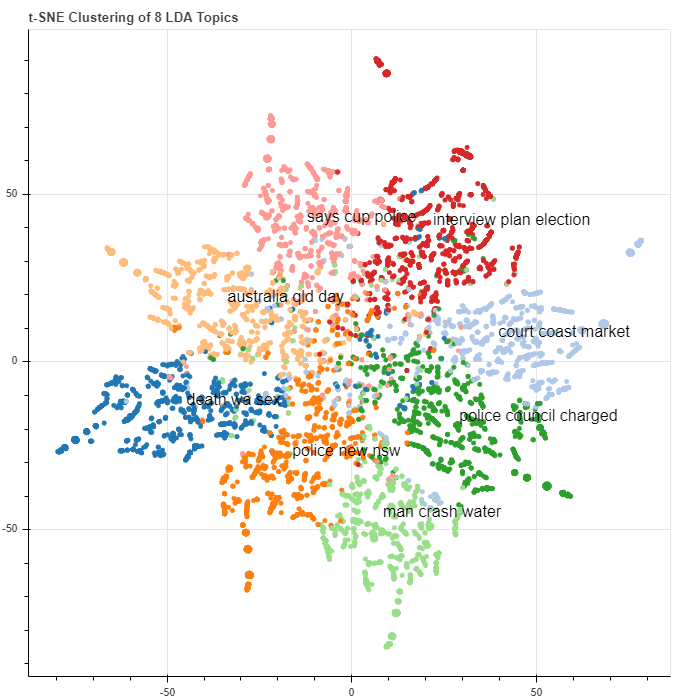
A clustering problem might be to group documents from a corpus into sets of documents they deal with the same topic.
The documents could be represented in space in the form of word vectors, and then grouped together in based on some form of similarity, which is able to relate documents containing words and expressions to each other common.
Reinforcement Learning
The third type of machine learning is Reinforcement Learning. The goal of this type of learning is to build a system (agent) that through interactions with the environment improves its performance.
In order to improve the functionality of the system, reinforcements, or reward signals, are introduced.
This reinforcement is not given by the labels or the correct truth values, but is a measurement of the quality of the actions taken by the system. For this reason it cannot be assimilated to supervised learning.
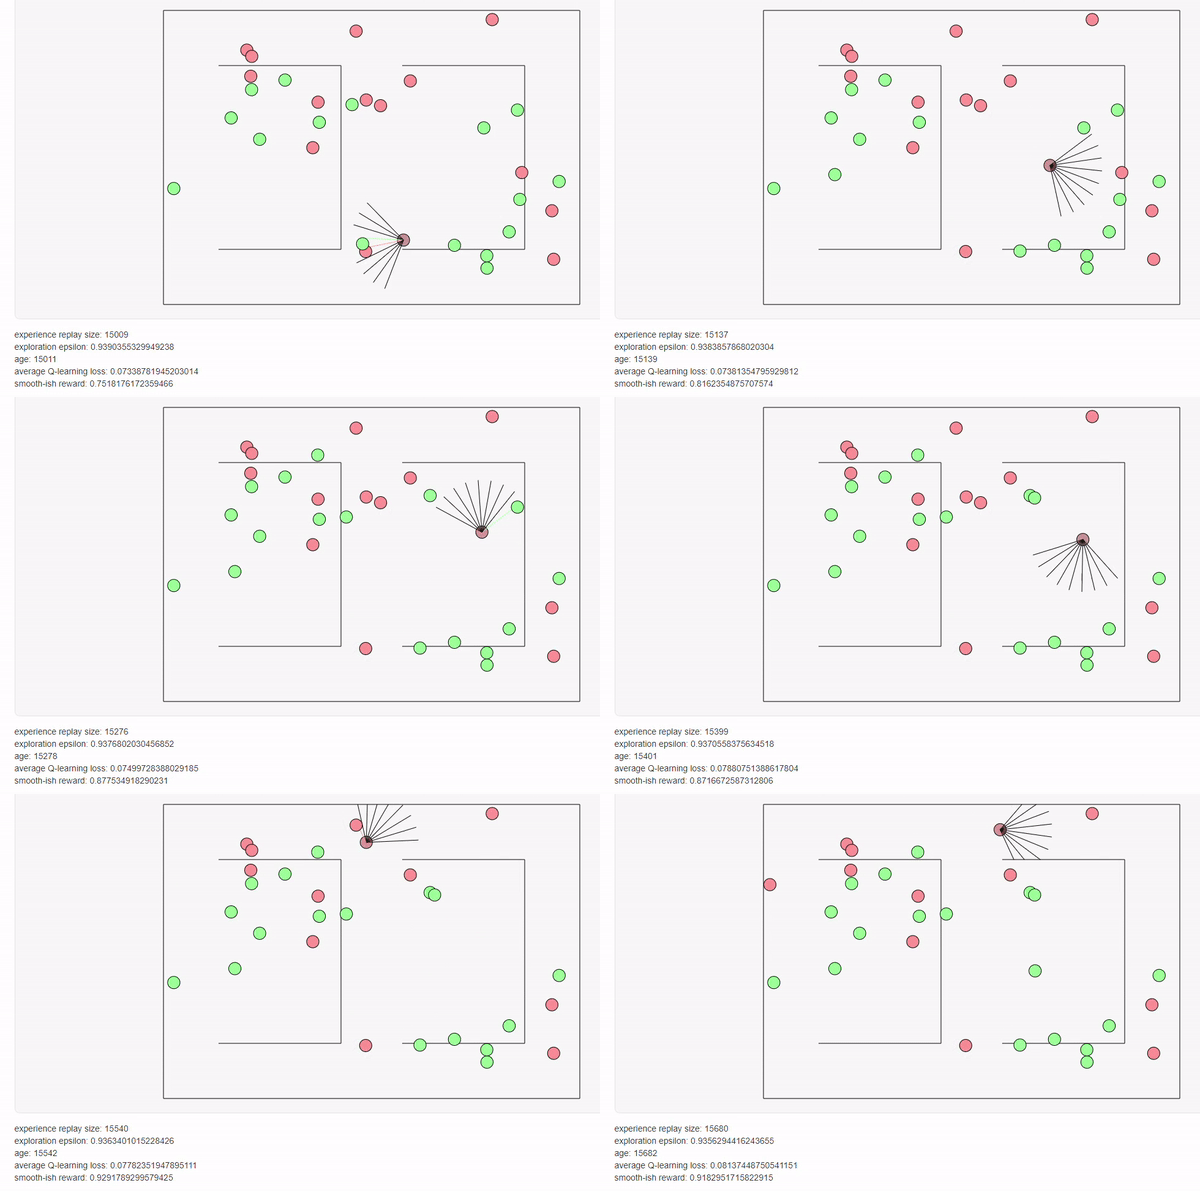
Reinforcement learning is widely used for robot navigation training. In the figure is shown the example of the return negative or positive rewards when the robot sucks them.
Deep Learning
Deep Learning is a large family of methods for machine learning based on artificial neural networks. Artificial neural networks are computational models based on a simplification of biological neural networks.

As can be seen in Figure 6, they can be made up of many nodes, or neurons, and multiple layers of neurons. Theoretically more the number of neurons and layers increases, more the network is able to represent more complex non-linear functions.
We are talking about computational models theorized as early as the 1970s, but for which at that time it was not possessed still enough computing power to use and apply them.
Today that computing and storage capacities have increased dramatically, they are back in fashion, and are used in many contexts of artificial intelligence.
If used in the form of nets with many layers, we speak precisely of deep learning, because we use very deep networks.
The ability to be able to formulate very complex non-linear functions across these networks has meant that they now come widely used in a series of very advanced tasks related above all to “natural perception”, such as computer vision and natural language processing.
Machine learning applications in industry
Machine learning and the set of techniques mentioned, can be very useful in industry in order to optimize and improve the production and sales process.
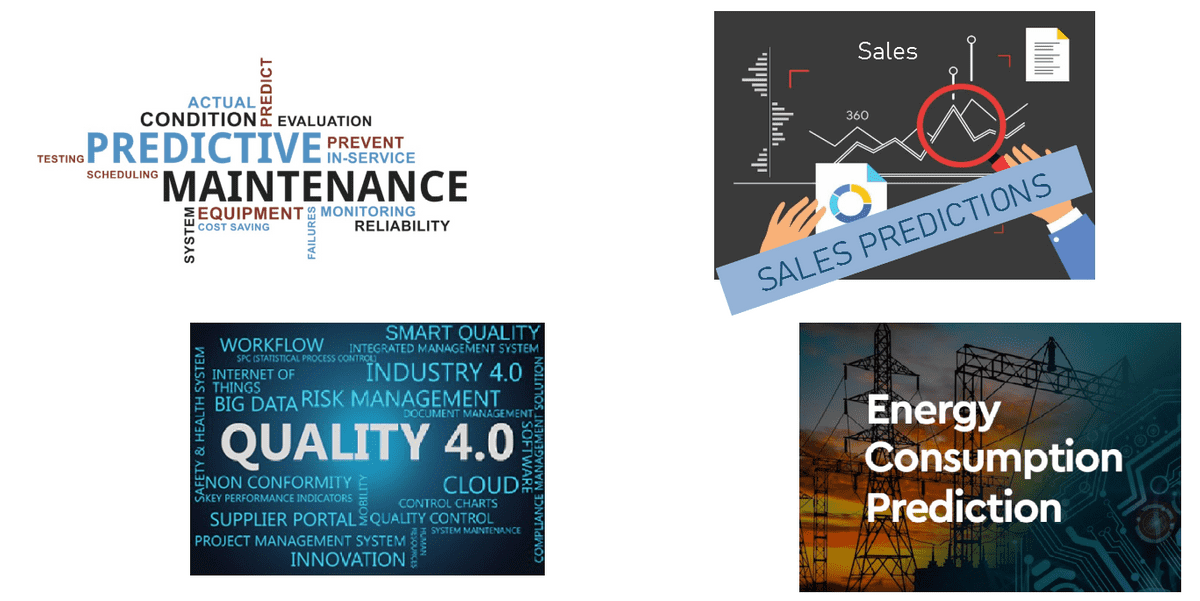
Some possible applications are:
- Predictive maintenance: predict failures and anomalies on machinery with the aim of managing efficiently maintenance , with an important return in terms of cost reduction
- Sales forecast: predict future sales levels in order to optimize the production process
- Product quality control (Quality 4.0): check the product quality by detecting production defects
- Forecast of energy consumption: forecast future energy consumption, with advantages both for those who have to request it and for those who it is an energy supplier
Applications in predictive maintenance
Below is an example of applying Supervised Learning algorithms and techniques for the use case of predictive maintenance.
The data used for the training are sensor data, coming from real machines, collected through the SMC IoT Experience platform. The goal is to create systems capable of:
- Predict how quickly a failure could occur on the machine (Regression)
- Predict if a failure could occur within a certain time window (Binary classification)
In trying to achieve all this, machine learning comes to our aid, thanks to the use of algorithms and models that are able to learn the correlations between the sensor data and and failures that occurred on the machinery.
Construction of the dataset
To build the dataset on which to train the algorithms, it was necessary to acquire the data relating to the historical faults that occurred on the machinery, as well as the telemetry history in the period of time preceding the considered failures.
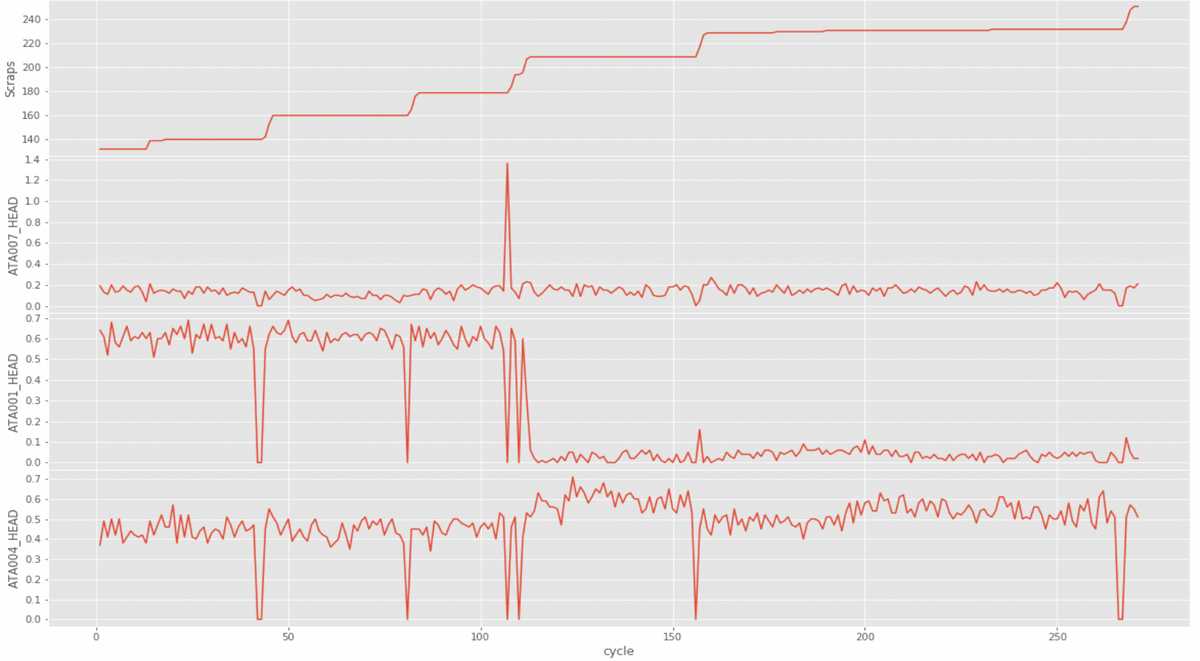
Once all the data was acquired, an in-depth feature engineering activity was carried out, i.e. an activity in which the data they have undergone filtering, processing and aggregation; this activity, every time you face a machine learning task, is fundamental to be able to put the data in the best shape to be able to efficiently train what is the chosen algorithm.
The data was subsequently labeled, so that a supervised training approach can be used.
To do this we have correlated two different values to each telemetric record:
- A continuous scale value, for the regression task, which specifies the time remaining to the fault at the time that the telemetry record was recorded
- A binary value, for the binary classification task, which indicates whether the telemetry record has been recorded within a certain time window since the fault
At the end of the labeling, a data set consisting of about 170 telemetry sequences preceding failures occurred on the same machine, is resulted, where each telemetry sequence has an amplitude between 250 and 300 minutes
Finally, the dataset was divided into:
- Training set (90% of the total, used for training)
- Test set (10% of the total, used to evaluate the performance of the trained model)
Trainings and evaluations
Some candidate algorithms for the task have been trained and tested. Some of these are:
- Light Gradient Boost Machine Classifier
- Extra Trees Regressor
- Random Forest Classifier
- Long Short-Term Memory Networks
After each training, it is essential to evaluate the performance of the resulting model. This is to compare both different algorithms between them, both different training configurations of the same algorithm, and identify the tool that work better on that specific task.
To carry out these evaluations, a series of metrics and graphs are used, which show how well the model is in question is able to perform the task for which he was trained.
In the case in question we can see, for example, the results of the evaluation carried out on the forecasting task if a fault could occur within a certain time window.
In particular, the results refer to the training of a “Light Gradient Boost Machine Classifier” with time window set at 30 minutes.

The “holdout score” column contains the values for metrics that present the model’s performance across the test set.
We have a total accuracy of 98.6%, with values of Precision and Recall also very high, which show satisfactory performance for the model in question.
For a more detailed view we also see the confusion matrix, which consists of a matrix that allows you to visualize false positives and false negatives, putting the real labels in relation with the values foreseen by the model..

From the confusion matrix it is found that:
- In 92.7% of cases, if we are close to a possible failure, the system is able to correctly predict it, while in 7.3% of cases is unable to report it
- 98.2% of the times that a possible imminent failure is reported, this will actually happen, while in 1.8% of the cases it will be a false alarm
Conclusions
The application techniques seen represent a possible action strategy to achieve, through machine learning, systems that support predictive maintenance.
For example, a system capable of predicting whether a failure could occur within 30 minutes could be used for install a traffic light on a machine that will signal, if the system foresees it, possible imminent faults.
This represents only one example of how machine learning and more generally artificial intelligence can help what is the production and decision-making process within the industrial environment.
In line with the transformation towards the so-called Industry 4.0, machine learning will play a role in the coming years fundamental for the growth and the ability of industries to keep up with the times.