Table of Contents
- Introduction to Causality in Machine Learning
- Correlation and Causation
- Case Study 1: A “Marvelous” Problem
- Scenario 1: A Direct Cause
- Scenario 2: Reversing the Cause and Effect
- Scenario 3: Investigating a Hidden Cause
- Causal Thinking
- Case Study 2: Food App Conundrum
- Quiz Time!
- Summary
- References
- Citation Information
Introduction to Causality in Machine Learning
In this tutorial, you will learn about causality and how to correctly interpret and use it for your machine learning projects.
This lesson is the 1st in a 4-part series on Causality in Machine Learning:
- Introduction to Causality in Machine Learning (this tutorial)
- Tools and Methodologies for Studying Causal Effect
- A Brief Introduction to Do-Calculus
- Studying Causal Effect with Microsoft’s Do-Why Library
It is a known phenomenon that Nobel laureates are avid chocolate lovers. This means, as we look at Nobel laureates’ food preferences, many of them love eating chocolates. But what if we reverse the relation?
Does eating chocolates help us get a Nobel prize? As avid chocolate lovers, we can confirm this is not the case. Why? What is the reason for such injustice, and how can we exploit that in machine learning? Let’s find out.
To learn how to understand and correctly interpret causality, just keep reading.
![]()
Looking for the source code to this post?
JUMP RIGHT TO THE DOWNLOADS SECTION
Introduction to Causality in Machine Learning
So, what does causal inference mean? What does it mean to cause? Is causality as simple as understanding cause and effect? Let us first understand a few ground rules before playing the game of causality. There is a lot of noise surrounding causality and its neighbor correlation.
For example, the following quote from François Chollet (as shown in Figure 1) makes the topic even more confusing.

Correlation and Causation
“Correlation does not mean Causation”: If you had a penny for every time you heard that line, you would probably be a millionaire by now. But what does it mean? Why does the correlation between two events do not imply causality? What is up?
Correlation is a relationship or connection between two variables where whenever one changes, the other is likely to also change. But a change in one variable doesn’t cause the other to change. That’s a correlation, but it’s not causation.
For example, if you see a lot of birds in the sky and it starts raining, it doesn’t mean that the birds caused the rain. They just happened at the same time.
Mathematically, correlation is measured by the correlation coefficient between `-1` and `1`. A correlation coefficient of `1` indicates a perfect positive correlation between two variables. In contrast, a correlation coefficient of `-1` means a perfect negative correlation between two variables. A correlation coefficient of `0` means no correlation between two variables.
Conversely, causation is a relationship between two variables where one variable causes the other variable to change.
At this point, you’re probably wondering: I have heard about causality a few hundred times, but do I need to care?
Let’s ask you a different question, then.
Case Study 1: A “Marvelous” Problem
How many times have you looked at the result of your model and wondered what-if the data was something other than what it trained on? You could write an algorithm that predicts the sales of comic books, and your model works well and produces high-accuracy predictions, but you need to know why. Or maybe it’s the opposite, your algorithm predicts completely wrong sales figures, and you need to figure out why.
Confused? Let’s look at an example.
Suppose Marvel hires you as a data scientist. There has been a recent rise in comic book sales, and you need to figure out why so the company can maintain the sales figures. After some data analysis, you conclude that there is a direct correlation between comic book sales and Disney+ subscriptions. But you still don’t have an exact reason, so you develop some scenarios to form a hypothesis.
Scenario 1: A Direct Cause
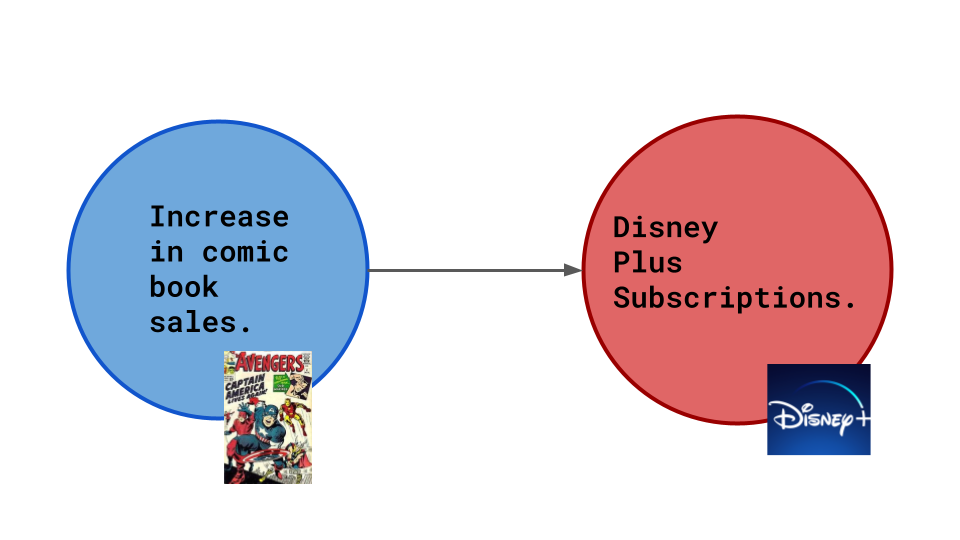
The comics display ads from Disney+, so increased comic book sales cause more Disney+ subscriptions.
Scenario 2: Reversing the Cause and Effect
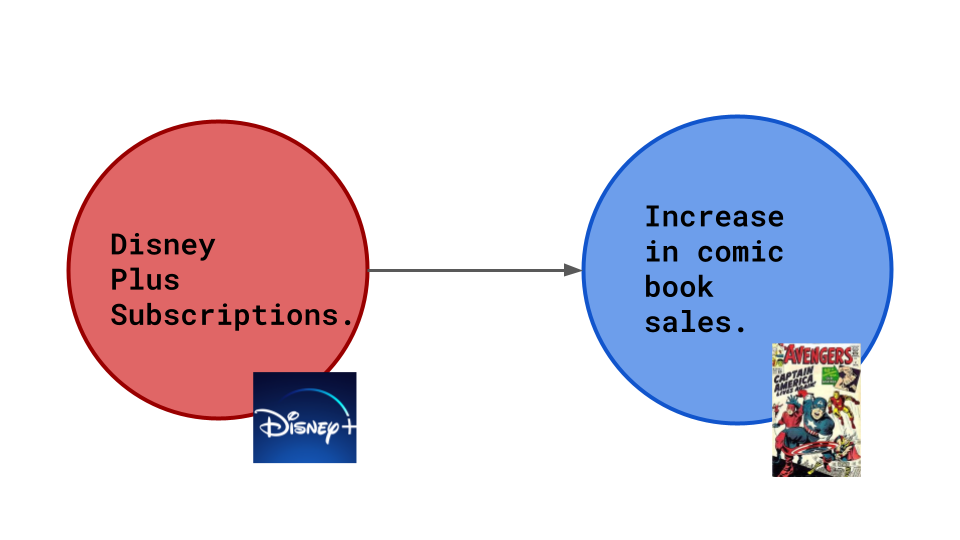
Disney+ has shows about comic book characters. New fans would like to consume more of such content. So an increase in Disney+ subscriptions led to more Marvel Comics being bought.
Scenario 3: Investigating a Hidden Cause
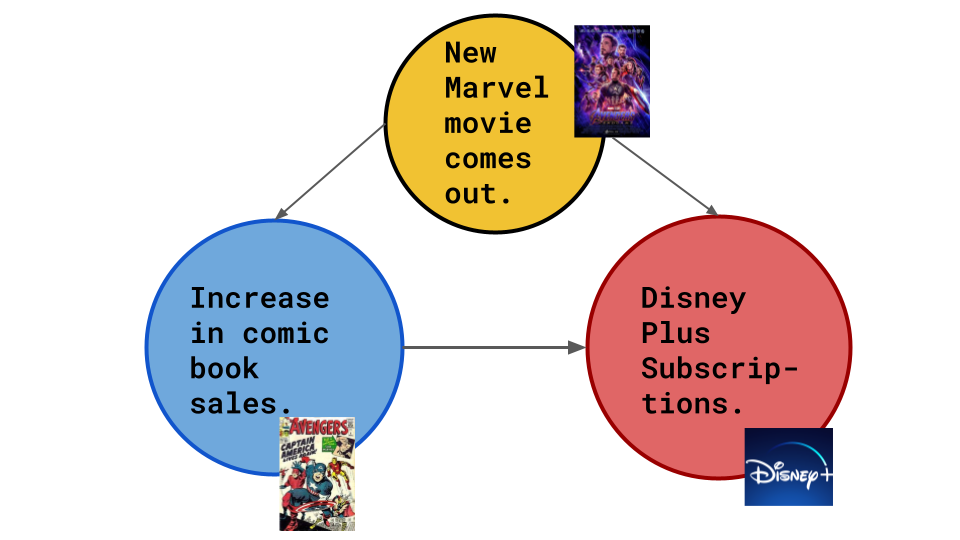
Or it’s something quite different. All Marvel Cinematic Universe movies are on Disney+. When a new Marvel movie comes out, the hype around these characters leads to more comic book sales (and, in turn, more Disney+ subscriptions).
Causal Thinking
The possibility presented in Scenario 3 is a hidden cause.
Each node is a variable, and each arrow shows the direction of the causal connection.
Suppose we build an accurate model to predict when the user will buy more comic books. But that is all that our model would do. The problem statement could be better expressed by a question like: What would the user have done if we had done something differently?
So you might think: I get it; the model doesn’t always consider hidden causes, but it still works. The predictions are still accurate.
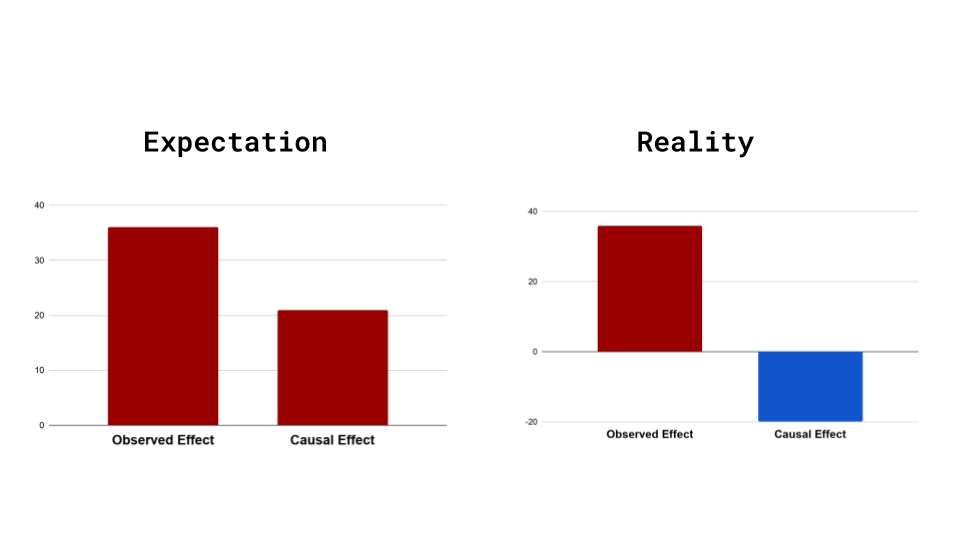
Having our observed and causal effects in the same direction is considered lucky. More often than not, we see the opposite in real-world data, as shown in Figure 5.
Case Study 2: Food App Conundrum
Let’s look at another example to understand this better: Suppose you have now been employed at a food ordering app as a Data Scientist. The product designer wants to introduce a new User Interface (UI), which she believes will engage more users. She has introduced the new UI to a select few people and wants you to make sense of the data that has been gathered.
You decide to judge the old UI and the new one on a common criterion: whether the user orders after opening the app. Let’s call this the opened-and-ordered criteria. Table 1 describes this.
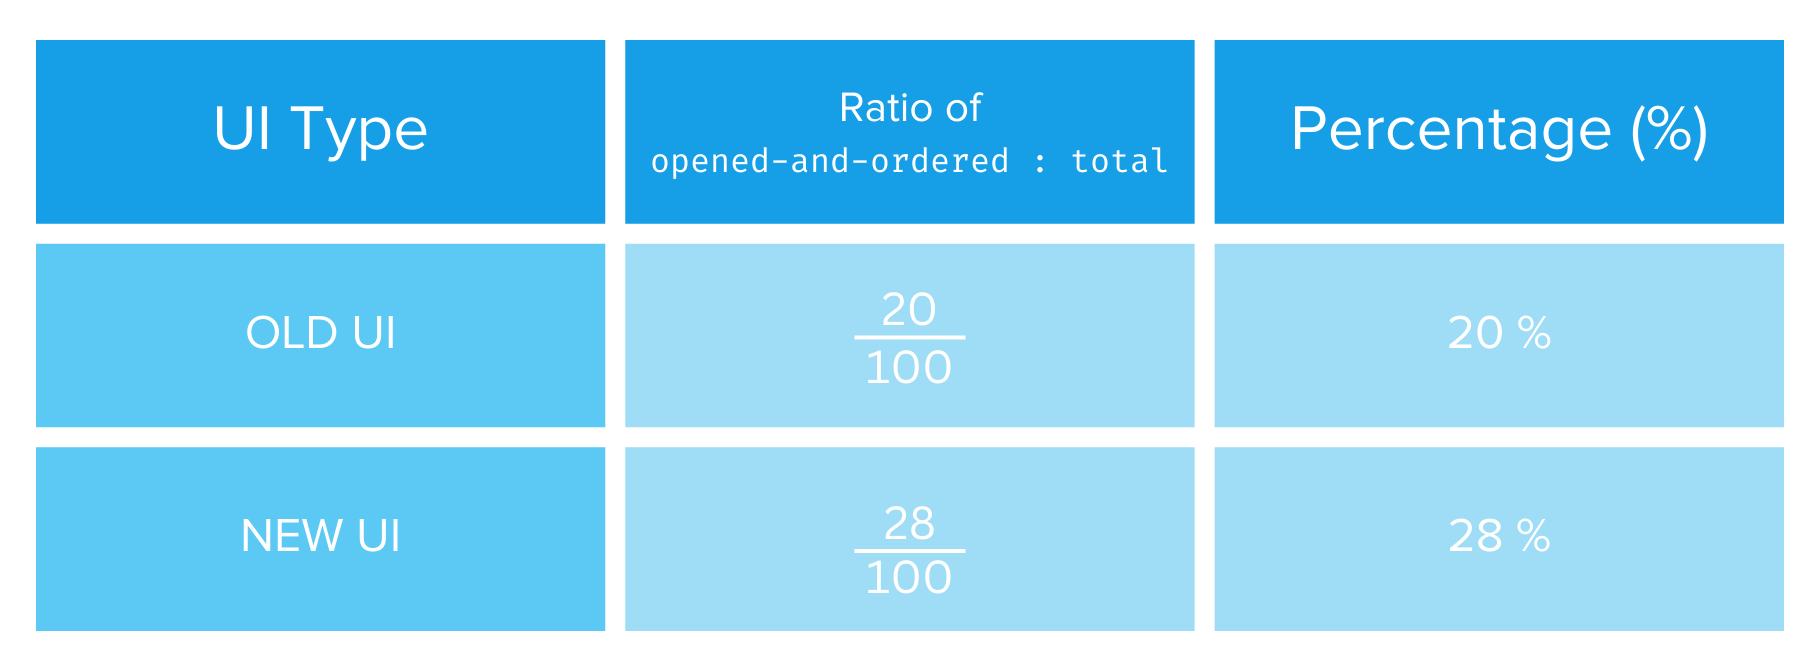
Based on this data, it seems pretty straightforward. The new UI is the clear winner. But something strange happens when you condition the data on high-activity vs. low-activity users, as shown in Table 2.
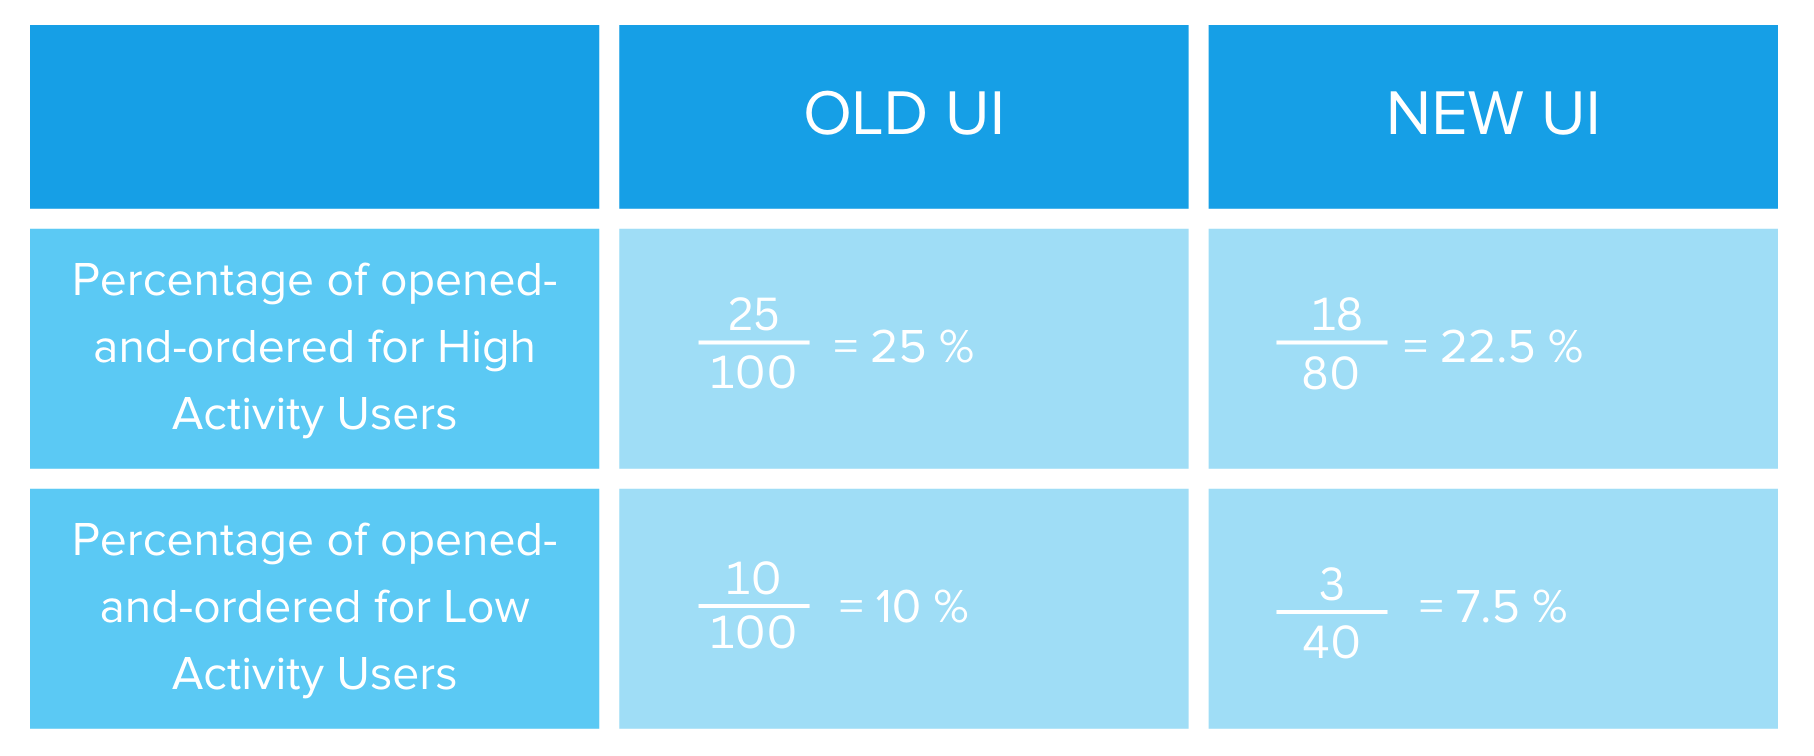
This data discrepancy modeled on a different subset of the original data is called “Simpson’s paradox.”
“But hey, why does this discrepancy occur?”
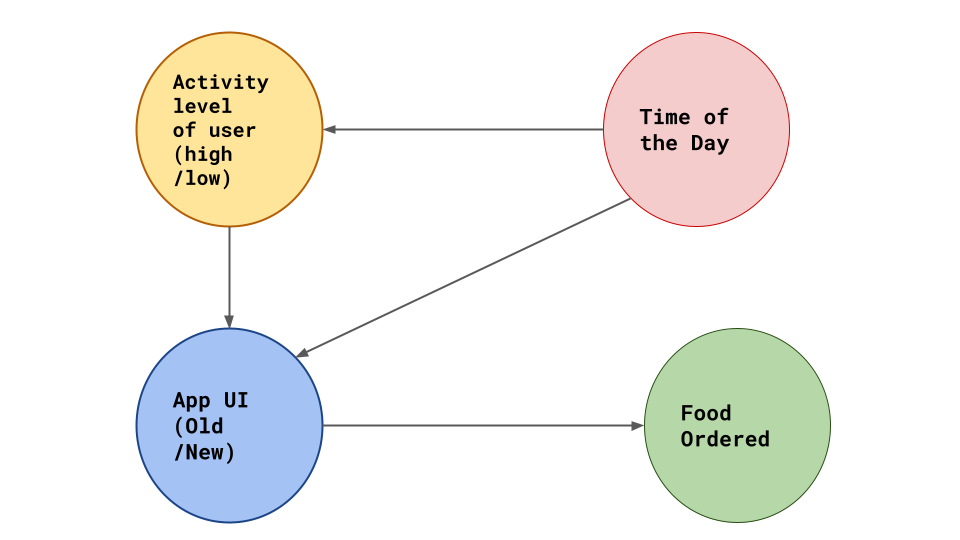
Well, maybe, since the old UI is already tried and tested, it is shown to users only at a particular time of the day, around the evening, when app activity is generally high. The new UI might be shown at other times of the day when the number of lower-activity users who are likely to order food is less.
The causal diagram may look like the following in Figure 6.
Quiz Time!
The debate on what it means to cause something and how cause precedes effect has been going on forever. Most prominent contestants include but are not limited to:
- Aristotle
- Homer
- Einstein
- That French guy from Matrix 3
- Judea Pearl, and many more
However, sadly, until recently, the science of causal inference was not considered formal mathematics or even something that could be quantified and studied.
This was remedied hugely by the contributions of Judea Pearl (Graphical Causal Models) and Donald Rubin (Rubin causal model).
Course information:
76 total classes • 90 hours of on-demand code walkthrough videos • Last updated: May 2023
★★★★★ 4.84 (128 Ratings) • 16,000+ Students Enrolled
I strongly believe that if you had the right teacher you could master computer vision and deep learning.
Do you think learning computer vision and deep learning has to be time-consuming, overwhelming, and complicated? Or has to involve complex mathematics and equations? Or requires a degree in computer science?
That’s not the case.
All you need to master computer vision and deep learning is for someone to explain things to you in simple, intuitive terms. And that’s exactly what I do. My mission is to change education and how complex Artificial Intelligence topics are taught.
If you’re serious about learning computer vision, your next stop should be PyImageSearch University, the most comprehensive computer vision, deep learning, and OpenCV course online today. Here you’ll learn how to successfully and confidently apply computer vision to your work, research, and projects. Join me in computer vision mastery.
Inside PyImageSearch University you’ll find:
- ✓ 76 courses on essential computer vision, deep learning, and OpenCV topics
- ✓ 76 Certificates of Completion
- ✓ 90 hours of on-demand video
- ✓ Brand new courses released regularly, ensuring you can keep up with state-of-the-art techniques
- ✓ Pre-configured Jupyter Notebooks in Google Colab
- ✓ Run all code examples in your web browser — works on Windows, macOS, and Linux (no dev environment configuration required!)
- ✓ Access to centralized code repos for all 500+ tutorials on PyImageSearch
- ✓ Easy one-click downloads for code, datasets, pre-trained models, etc.
- ✓ Access on mobile, laptop, desktop, etc.
CLICK HERE TO JOIN PYIMAGESEARCH UNIVERSITY
Summary
So, in conclusion, we learned here that simply because two variables are correlated does not necessarily mean that one is the direct cause of the other. We can do more harm through our model if we do not look for hidden causes and their effects.
Therefore the idea of what would happen had something in the observation process been changed becomes an imperative question to ask.
This is called Counterfactual Thinking.
Counterfactual thinking, specifically about what-if scenarios, is the heart of causal inference.
Some ways we can answer a counterfactual question are:
- Randomization
- Natural Experiments
- Conditioning
Interestingly, the methods become much harder to use as we go down the list. But as we go up, the methods are more foolproof and give better validation results. We will closely examine these and the various underlying methodologies in the next blog post of this series. Till then, keep learning, and don’t stop asking the question: What-If?
References
- Causal Inference in Online Systems by Amit Sharma
- An awesome playlist for Causal Learning
- The Book of Why: The New Science of Cause and Effect