R is an open-source free programming language for statistical computing, data analysis, and graphics. R is used by a growing number of managers and data analysts inside corporations and academia. R has a wide variety of packages for data mining.
Course Outline
Introduction and preliminaries
Making R more friendly, R and available GUIs
Rstudio
Related software and documentation
R and statistics
Using R interactively
An introductory session
Getting help with functions and features
R commands, case sensitivity, etc.
Recall and correction of previous commands
Executing commands from or diverting output to a file
Data permanency and removing objects
Simple manipulations; numbers and vectors
Vectors and assignment
Vector arithmetic
Generating regular sequences
Logical vectors
Missing values
Character vectors
Index vectors; selecting and modifying subsets of a data set
Other types of objects
Objects, their modes and attributes
Intrinsic attributes: mode and length
Changing the length of an object
Getting and setting attributes
The class of an object
Arrays and matrices
Arrays
Array indexing. Subsections of an array
Index matrices
The array() function
The outer product of two arrays
Generalized transpose of an array
Matrix facilities
Matrix multiplication
Linear equations and inversion
Eigenvalues and eigenvectors
Singular value decomposition and determinants
Least squares fitting and the QR decomposition
Forming partitioned matrices, cbind() and rbind()
The concatenation function, (), with arrays
Frequency tables from factors
Lists and data frames
Lists
Constructing and modifying lists
Concatenating lists
Data frames
Making data frames
attach() and detach()
Working with data frames
Attaching arbitrary lists
Managing the search path
Data manipulation
Selecting, subsetting observations and variables
Filtering, grouping
Recoding, transformations
Aggregation, combining data sets
Character manipulation, stringr package
Reading data
Txt files
CSV files
XLS, XLSX files
SPSS, SAS, Stata,… and other formats data
Exporting data to txt, csv and other formats
Accessing data from databases using SQL language
Probability distributions
R as a set of statistical tables
Examining the distribution of a set of data
One- and two-sample tests
Grouping, loops and conditional execution
Grouped expressions
Control statements
Conditional execution: if statements
Repetitive execution: for loops, repeat and while
Writing your own functions
Simple examples
Defining new binary operators
Named arguments and defaults
The ‘…’ argument
Assignments within functions
More advanced examples
Efficiency factors in block designs
Dropping all names in a printed array
Recursive numerical integration
Scope
Customizing the environment
Classes, generic functions and object orientation
Graphical procedures
High-level plotting commands
The plot() function
Displaying multivariate data
Display graphics
Arguments to high-level plotting functions
Basic visualisation graphs
Multivariate relations with lattice and ggplot package
Enter the world of Neural Networks and Financial Forecasting with this free course.
Can you forecast the returns of your favorite stock using Machine Learning?
Artificial Intelligence is certainly changing the world:
From the way we get our content, autonomous driving, medical advances to art creation.
Financial Machine Learning is one of the industries with a bigger impact on these technologies, from Roboadvisors to Algorithmic Trading.
Most recommendations made by firms are based on Artificial Intelligence nowadays, rendering most conventional analysts useless.
The same happens for traders, not many years ago trading was done manually, currently a huge share of the market is being traded by AI.
These advances have changed the game, gaining insight with edges the human eye can’t see anymore.
While the biggest financial institutions have been trading using Artificial Intelligence for years, most retail traders don’t know how to use nor benefit from them, we are here to change that.
Roll up your sleeves with this hands-on project where you are going to learn by doing and interacting with code, completely from scratch.
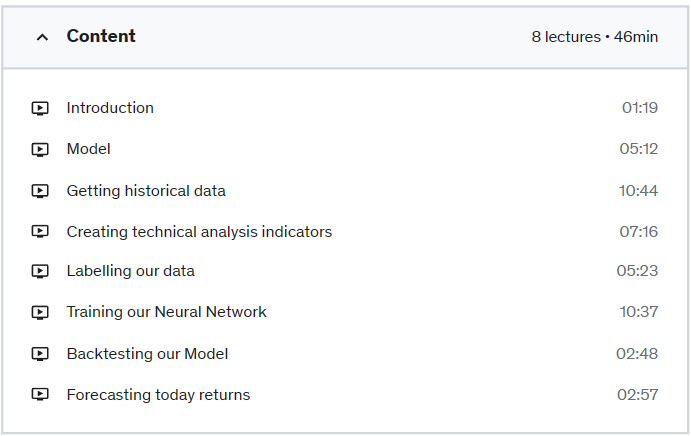
In this course you are going to learn how to:
Download Historical Data from your code, automatically.
Prepare your data with the most suitable indicators.
How to label and prepare data to feed our model.
Prepare a Neural Network.
Evaluate models.
Backtest your ML Model.
Create accurate stock forecasts.
We hope you enjoy this course.
Genbox Trading
Who this course is for:
traders and coders who wants to use Machine Learning