Use Python for Machine Learning to classify breast cancer as either Malignant or Benign.
Implement Machine Learning Algorithms
Exploratory Data Analysis
Learn to use Pandas for Data Analysis
Learn to use NumPy for Numerical Data
Learn to use Matplotlib for Python Plotting
Use Plotly for interactive dynamic visualizations
Learn to use Seaborn for Python Graphical Representation
Logistic Regression
Random Forest and Decision Trees
Requirements
- Basics of Python
- Some high school mathematics level.
- Some programming experience
Description
Here you will learn to build three models that are Logistic regression model, the Decision Tree model, and Random Forest Classifier model using Scikit-learn to classify breast cancer as either Malignant or Benign.
We will use the Breast Cancer Wisconsin (Diagnostic) Data Set from Kaggle.
Prerequisite
You should be familiar with the Python Programming language and you should have a theoretical understanding of the three algorithms that is Logistic regression model, Decision Tree model, and Random Forest Classifier model.
Learn Step-By-Step
In this course you will be taught through these steps:
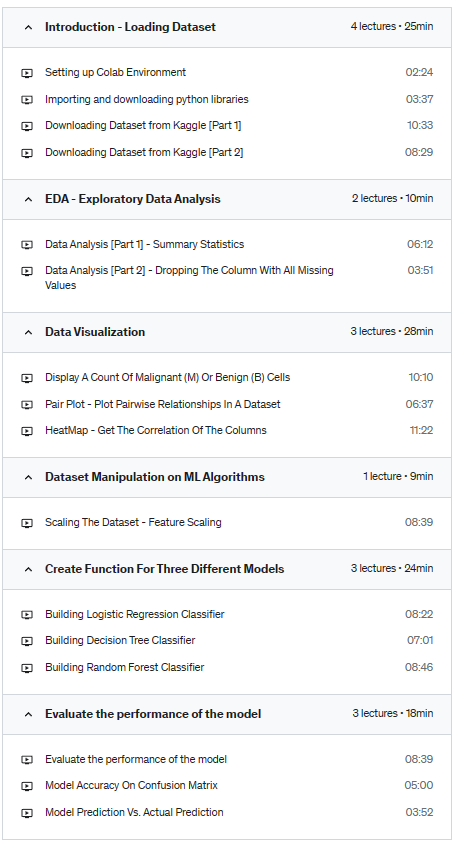
- Section 1: Loading Dataset
- Introduction and Import Libraries
- Download Dataset directly from Kaggle
- 2nd Way To Load Data To Colab
- Section 2: EDA – Exploratory Data Analysis
- Checking The Total Number Of Rows And Columns
- Checking The Columns And Their Corresponding Data Types (Along With Finding Whether They Contain Null Values Or Not)
- 2nd Way To Check For Null Values
- Dropping The Column With All Missing Values
- Checking Datatypes
- Section 3: Visualization
- Display A Count Of Malignant (M) Or Benign (B) Cells
- Visualizing The Counts Of Both Cells
- Perform LabelEncoding – Encode The ‘diagnosis’ Column Or Categorical Data Values
- Pair Plot – Plot Pairwise Relationships In A Dataset
- Get The Correlation Of The Columns -> How One Column Can Influence The Other Visualizing The Correlation
- Section 4: Dataset Manipulation on ML Algorithms
- Split the data into Independent and Dependent sets to perform Feature Scaling
- Scaling The Dataset – Feature Scaling
- Section 5: Create Function For Three Different Models
- Building Logistic Regression Classifier
- Building Decision Tree Classifier
- Building Random Forest Classifier
- Section 6: Evaluate the performance of the model
- Printing Accuracy Of Each Model On The Training Dataset
- Model Accuracy On Confusion Matrix
- 2nd Way To Get Metrics
- Prediction
Conclusion
By the end of this project, you will be able to build three classifiers to classify cancerous and noncancerous patients. You will also be able to set up and work with the Google colab environment. Additionally, you will also be able to clean and prepare data for analysis.
Who this course is for:
- Interested in the field of Machine Learning? Then this course is for you!
- This course had been designed to be your guide to learning how to use the power of Python to analyze data, create some good beautiful visualization for better understanding and use some powerful machine learning algorithms.
- This course will also give you a hands-on walk through step-by-step into the world of machine learning and how amazing it is to make prediction on some serious real-life problems. This course will not only help you develop new skills and improve your understanding but also grow confidence in you.
Course content